
The League of Nations marks a turning point in the history of international relations in that it is the first model of a “world parliament”. But who paid for it? The member states contributed according to their economic capacity and their political will. The map below shows the total contributions by states, based on the final report of the Board of Liquidation of the League of Nations in 1947, as the institution gave way to the newly created United Nations.
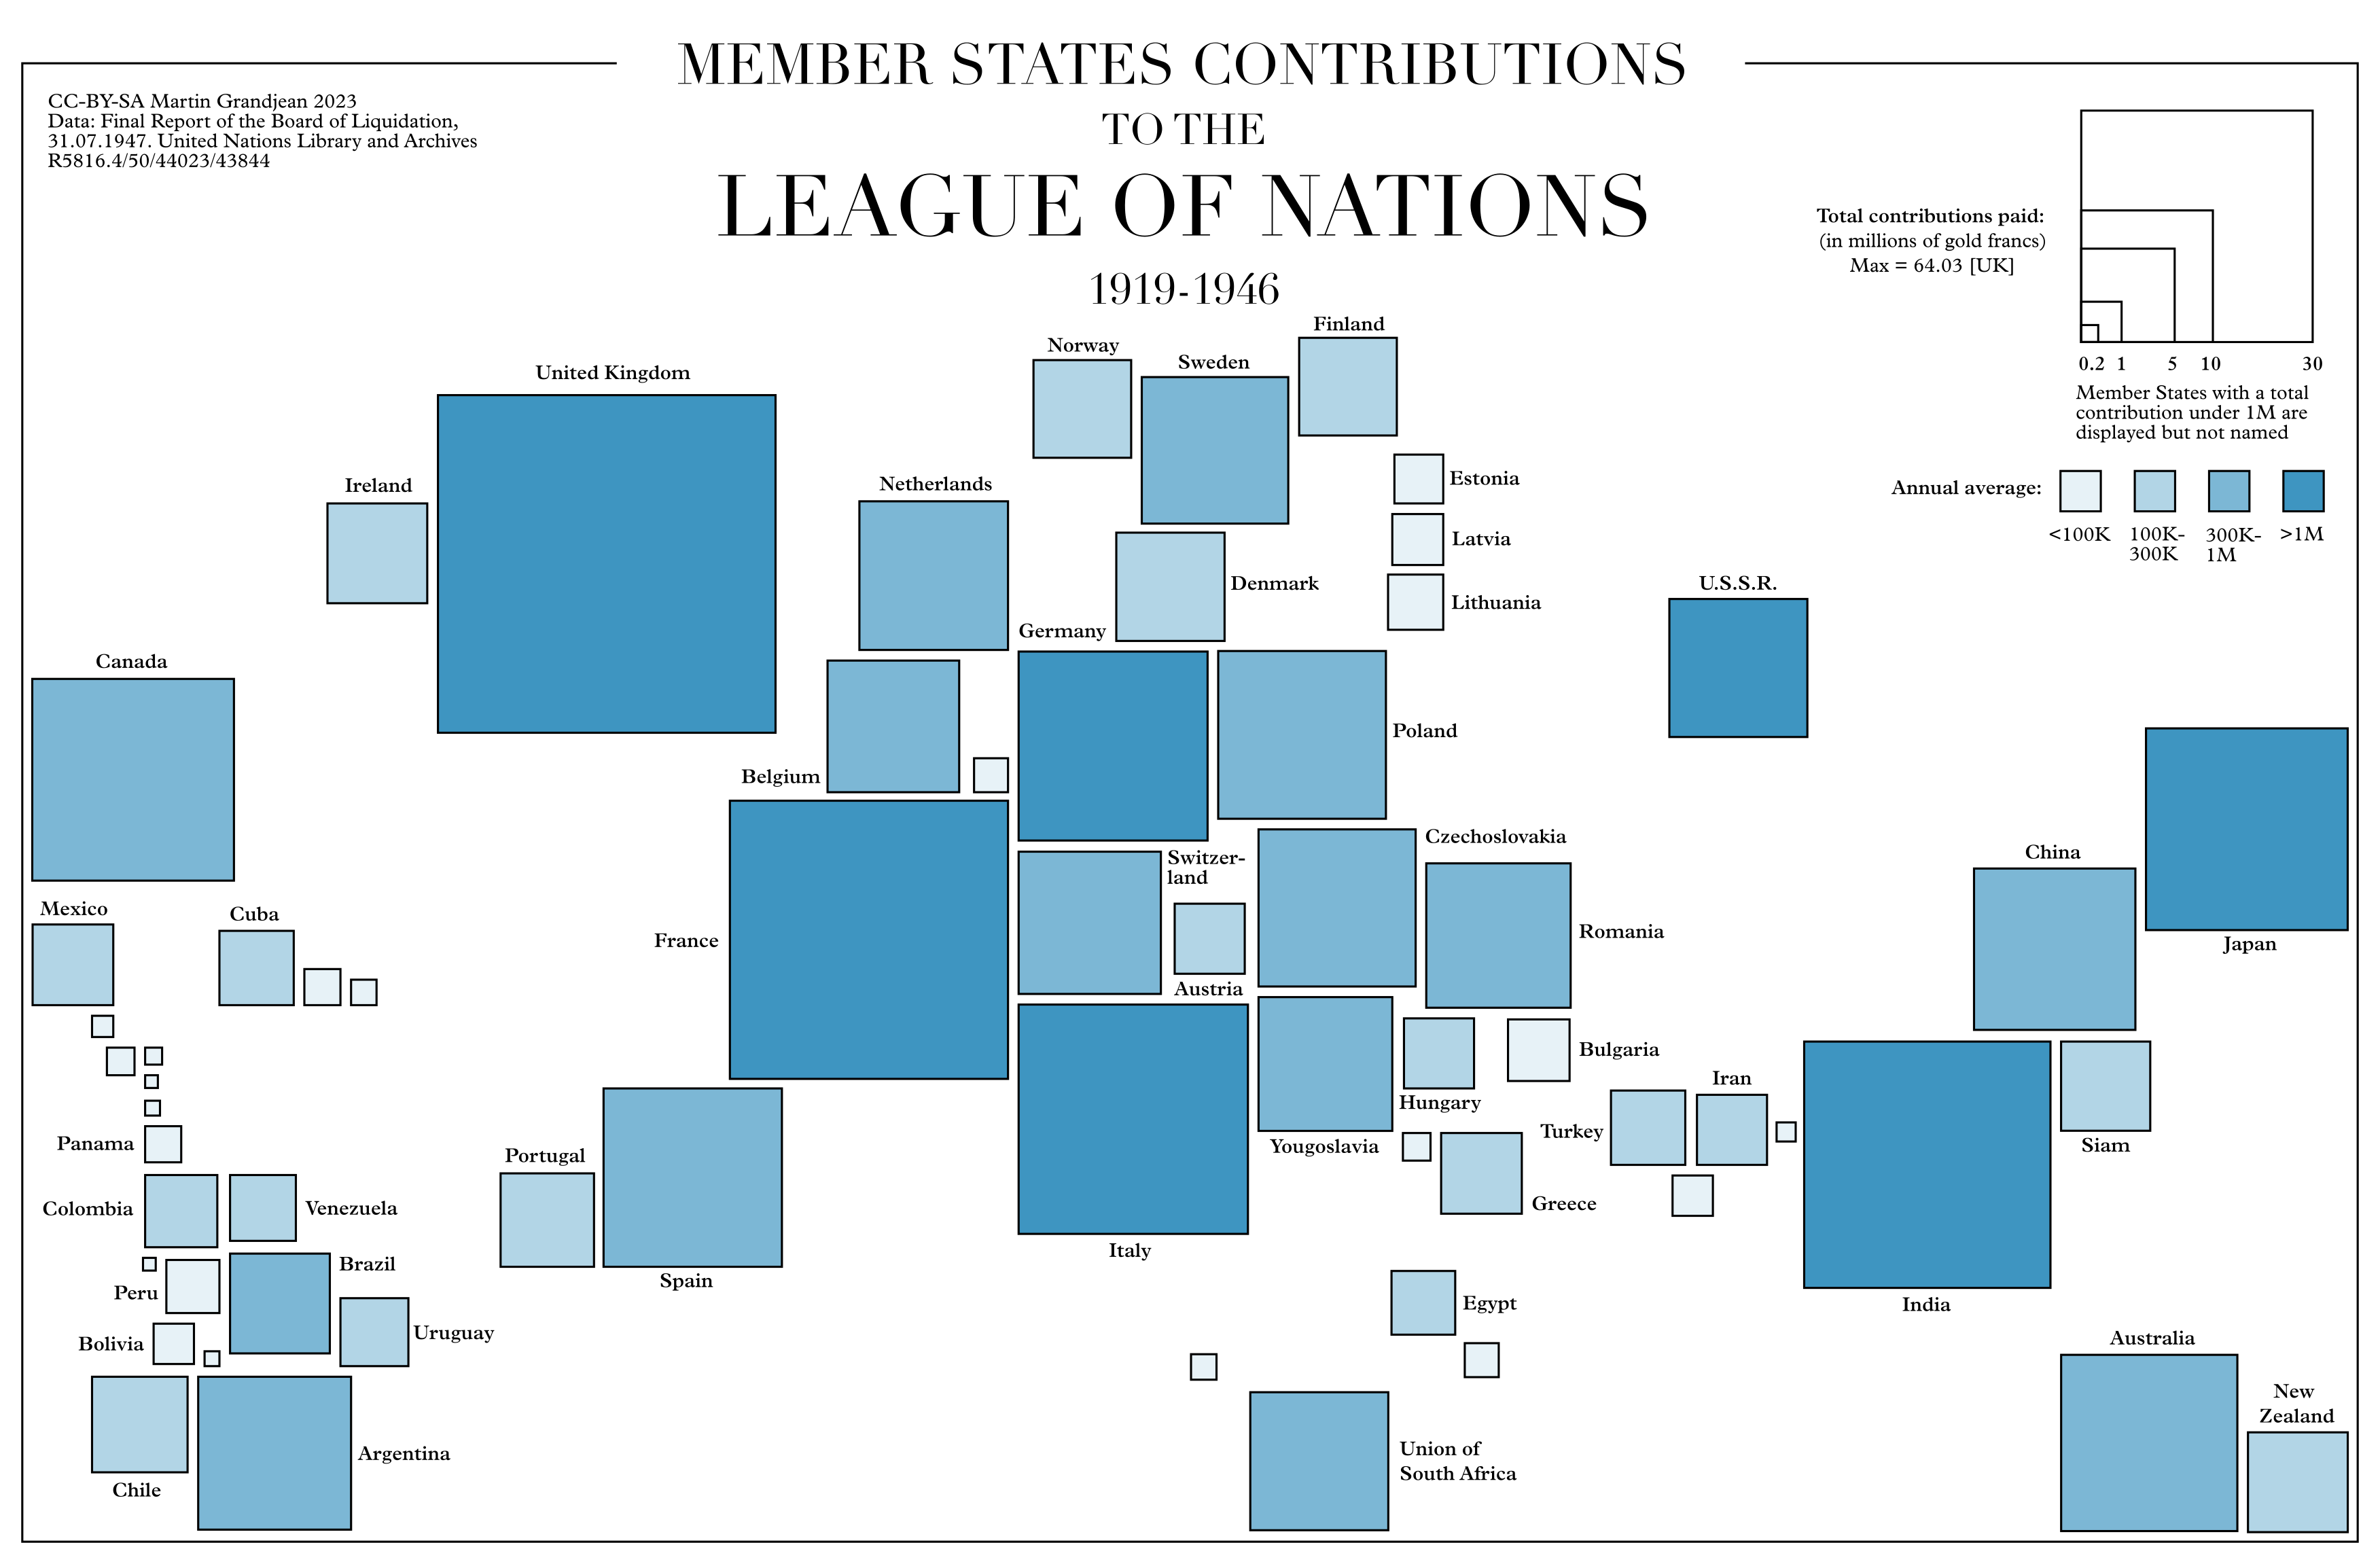
In the map above, the size of the squares is proportional to the total contribution, while the color gives an indication of the size of the annual contribution. The distinction is important because comparing the total does not take into account the fact that not all states have been members for the same amount of time. Some joined the League of Nations later, such as Turkey, Ethiopia or Finland. Some founding members left the organization, like Brazil, Japan or Italy. And others joined later and left earlier, like Germany or the USSR. Note that not all states were good payers, which means that this is the average of what they actually paid, not the amount they were theoretically expected to pay each year.
This map is licensed under CC-BY-SA, which means it can be freely reused with a citation to this post.
Comment
The contributions of the member states represent the vast majority of the income of the League of Nations. But these are not the only financial inputs of the organization. First, the League of Nations sells its publications, which provides a modest income. Secondly, and most importantly, partners (member states, other states, private organizations, etc.) can finance specific projects. This does not increase the budget of the League itself, but it contributes to its influence and efficiency. The United States of America, the main economic and political power absent from the above map because it has not ratified its official participation in the League, is not absent from financing. But it is mainly private actors like the Rockefeller Foundation that finance – sometimes massively – activities in the field of health or the construction of the library, for example. On this subject, see TYLER Hannah, “Breaking Even for the Future: The Financial History of the League of Nations Between 1919 and 1933”, Monde(s) 2021/1 (N° 19), p. 119-138 (online). As another example, but from a state actor this time: from 1926 to 1940, the French government financed most of the operating costs of the International Institute of Intellectual Cooperation in Paris (other member states participated in the financing).
Related documents
Here are two documents that are directly related to this map.
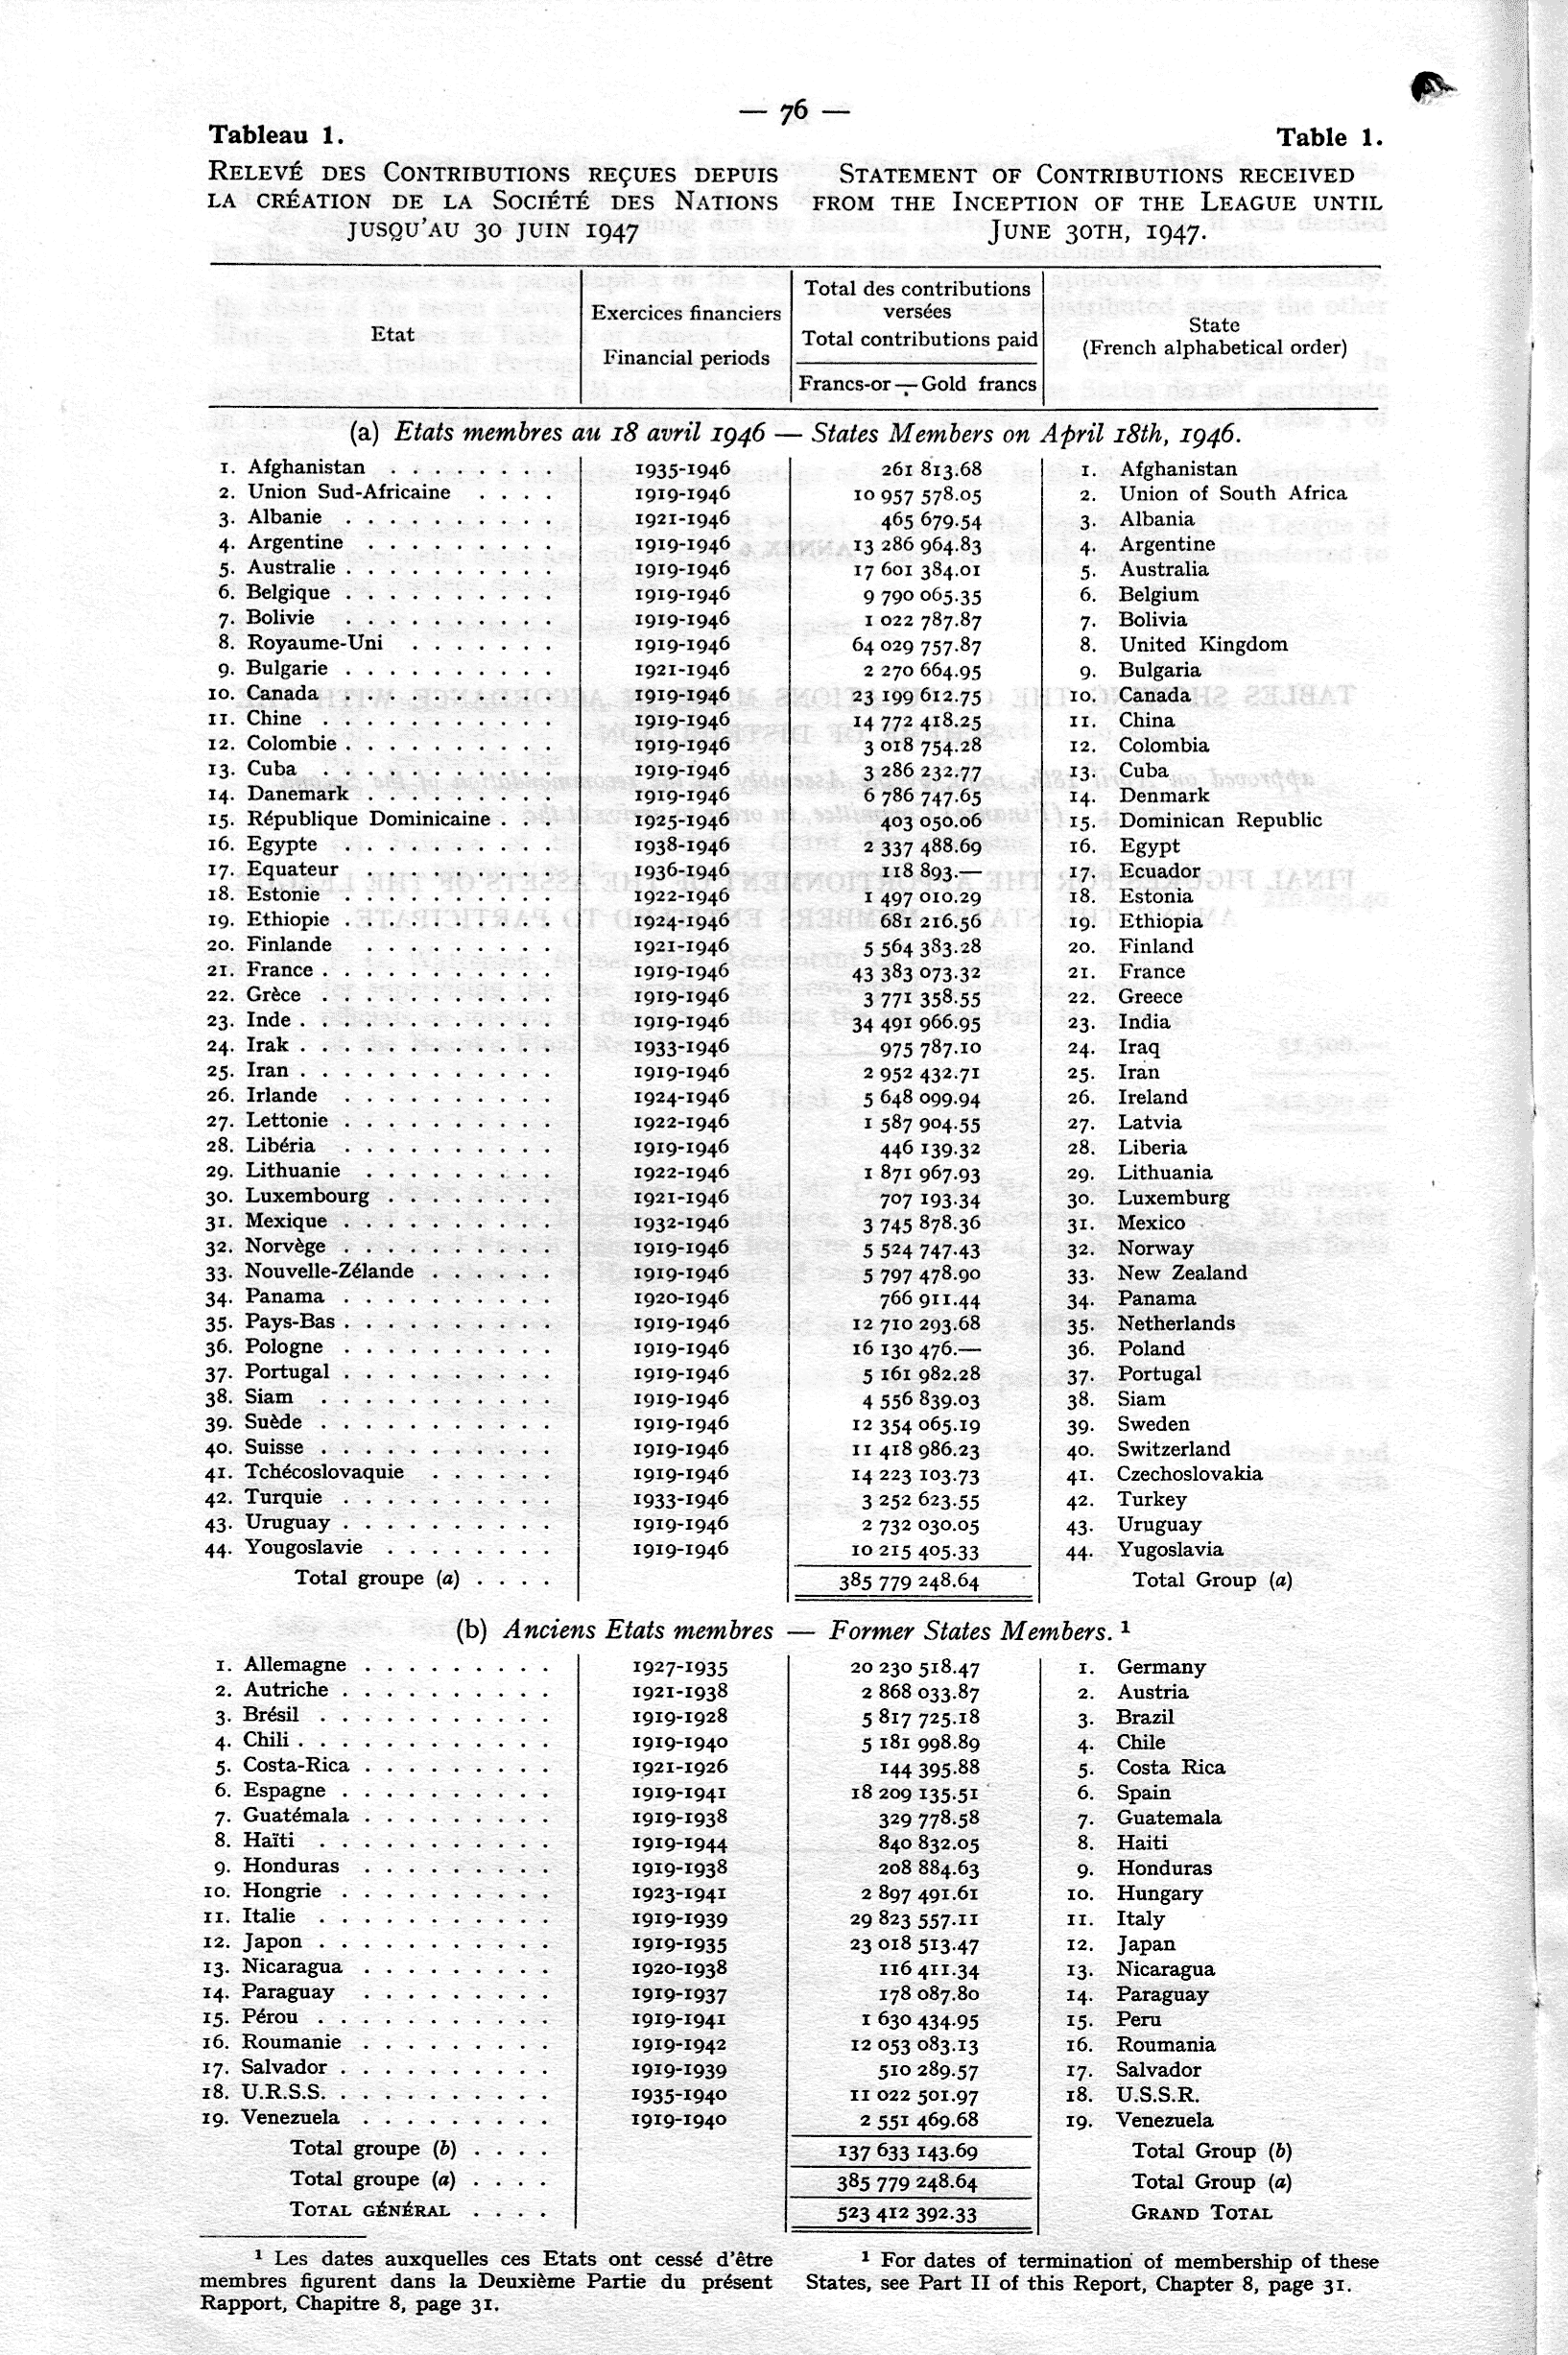
Statement of Contributions received from the Inception of the League until June 30th, 1947 |
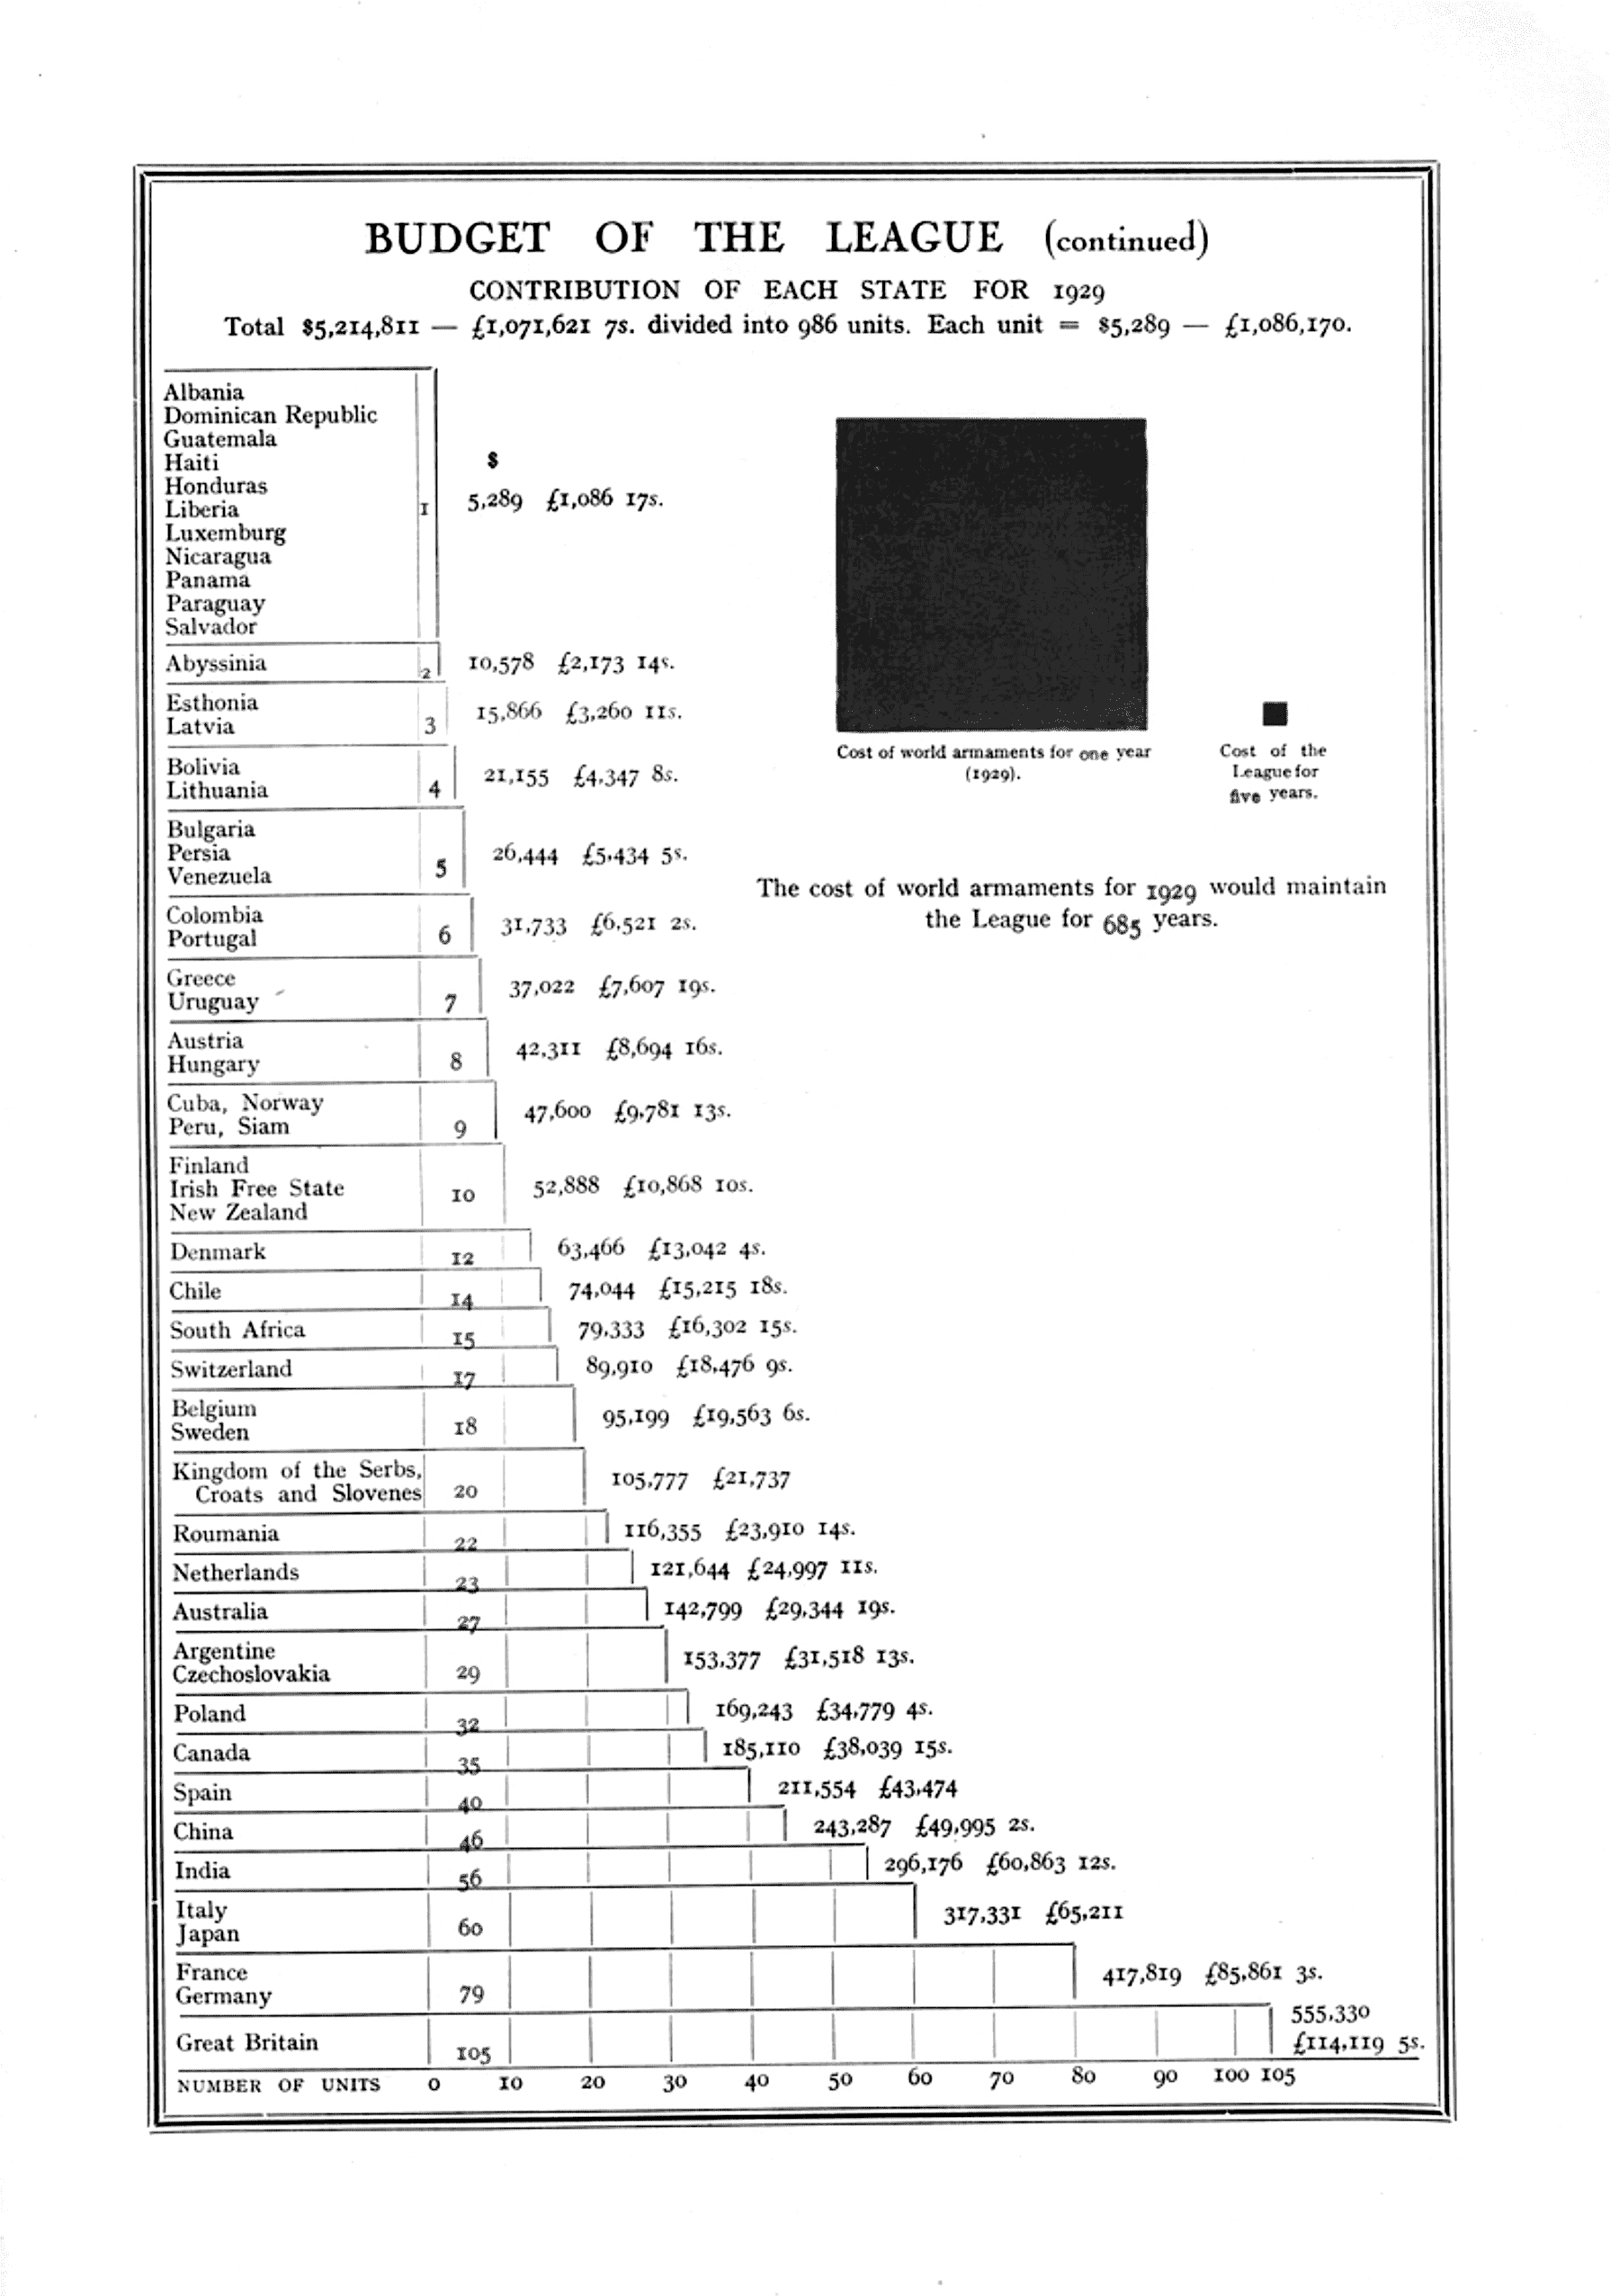
Budget of the League, Contribution of each state for 1929 |
| Final Report of the Board of Liquidation, 31.07.1947. United Nations Library and Archives R5816.4/50/44023/43844. Available online (see jacket 3). | The League of Nations: A Pictorial Survey, Société des Nations, Genève, 1929, p.33. Available online. |
 |
 |
About
This map was inspired by a tweet from the United Nations Library in Geneva, and Ronny Patz’ response.