
[fivecol_three_first]
INTRODUCTION
In Switzerland, the panorama of scientific research is deemed to be deeply affected by language barriers and strong local academic identities. Is this impression confirmed by data on research projects? What are the factors that best explain the structure of scientific collaborations over the last forty years? Do linguistic regions or local academic logics really have an impact onto the mapping of research collaborations and to what extend are they embedded in disciplinary, historical and generational logics?
We focus on the very large database of the Swiss National Science Foundation (SNSF), the principal research funding agency in Switzerland, which lists all the 62.000 projects funded between 1975 and 2015. While scientometric studies generally focus on measuring work – and financial – performance, we aim to raise awareness on pursuing a socio-historical analysis of Swiss academic circles by crossing the SNSF data with a prosopographic database of all Swiss university professors in the twentieth century provided by the Swiss Elite Observatory (OBELIS).
ANALYSIS
Here, we are interested in the 2006-2015 period, ten years during which 25.000 projects involving 45.000 people produce a 2-mode graph of more than 63.000 edges. To focus on projects and disciplines, the network is projected into a 1-mode graph of projects only. Thus, the graph displayed below contains over 15.000 projects that were funded between 2006 and 2015. The remaining 10.000 are isolated projects that are not displayed to avoid overloading the graph, but they are taken into account in the analysis of the relationships between disciplines (2nd graph below).
[/fivecol_three_first][fivecol_two_last]
POSTER
| Grandjean Martin, Benz Pierre & Rossier Thierry Complex Network Visualisation for the History of Interdisciplinary: Mapping Research Funding in Switzerland Digital Humanities 2017, Montreal (Canada). |

[/fivecol_two_last]
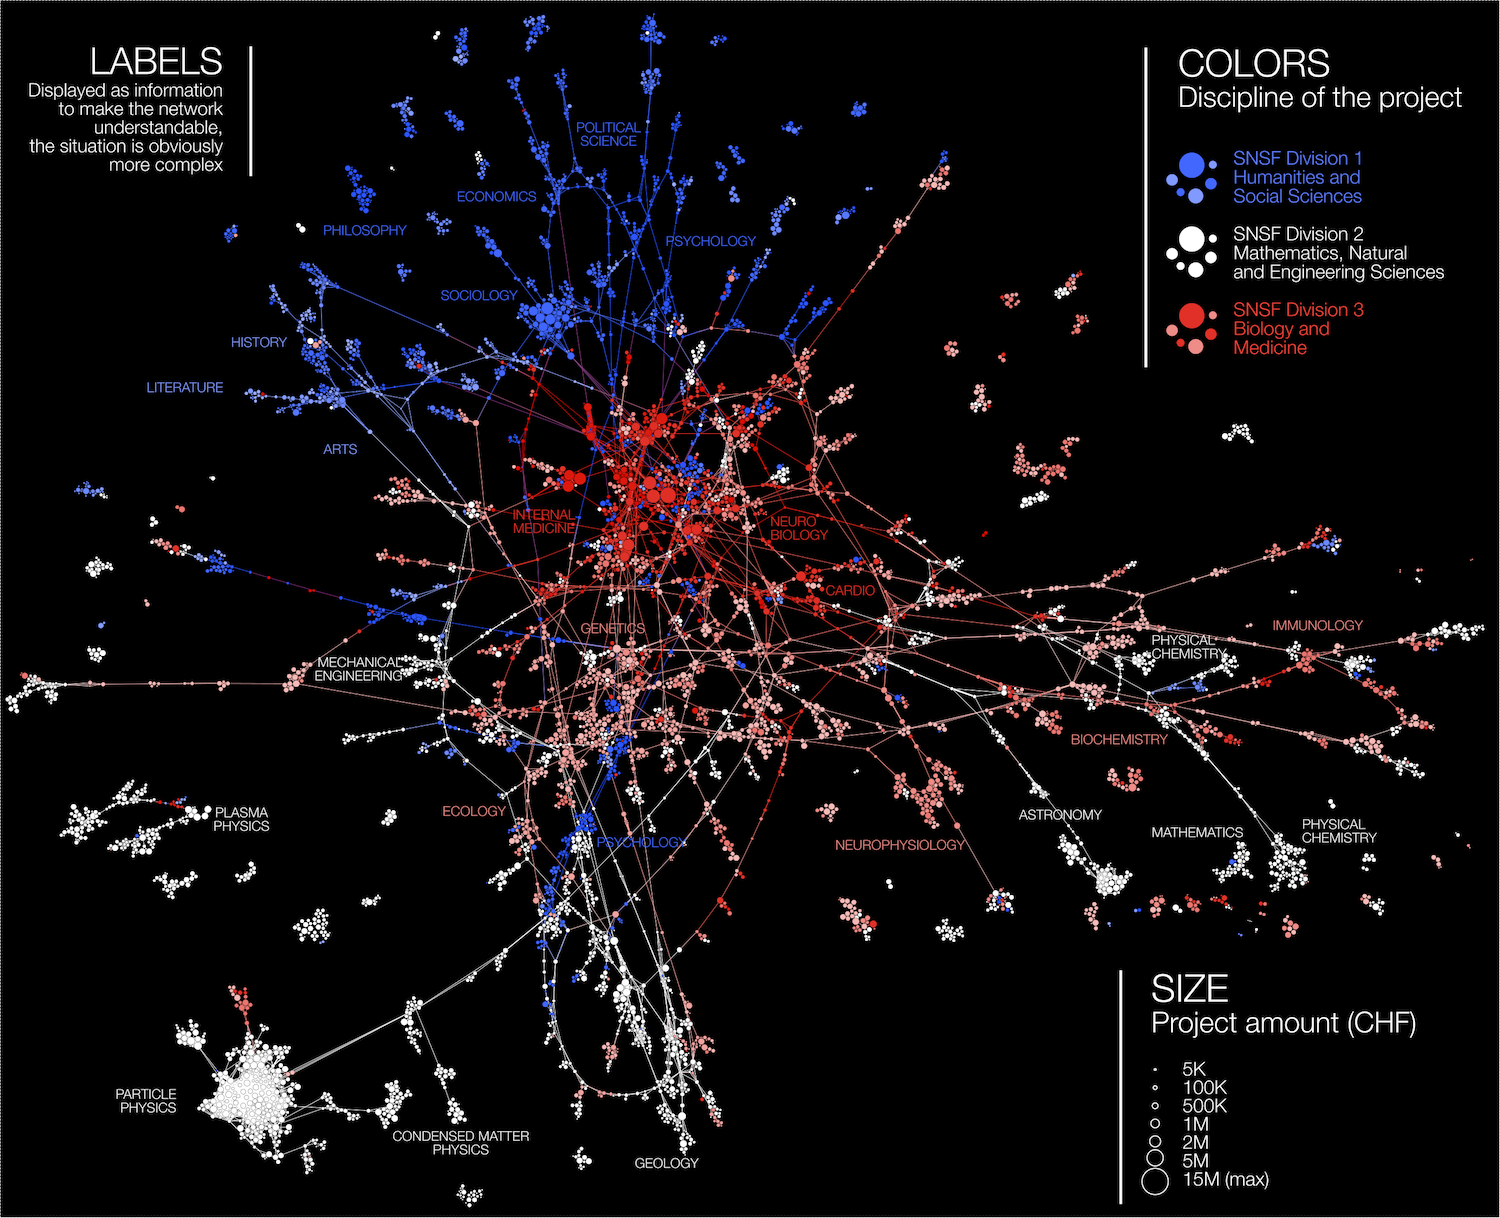
15.000 projects funded by SNSF between 2006 and 2015. Two projets are connected if they share one or more common researcher. Full size here.
The graph is very sparse in some places, particularly in disciplines where researchers work alone or in small groups (law, economics, humanities). In the natural sciences or medicine, projects often involve larger laboratories and thus create denser clusters. In order to say more about the interdisciplinarity of these fields, it is obviously necessary to develop the categories and to calculate individual measures, but the disciplines in which the collaborations occur are already clearly visible.
MAPPING DISCIPLINES
Reduced to the disciplines (below), the macro-network is more readable and will allow comparison over time. The graph of the disciplines shows that the three major divisions of the funding agency no longer fit perfectly to the reality of the 21st century: many sub-fields of biology (division 3, with medicine) and chemistry (division 2, with mathematics and engineering sciences) are more linked together than with the other sub-fields of their official divisions (see the pink nodes, affiliated with division 3 but very close to division 2). Understanding the evolution of this situation is of course one of our major goal.
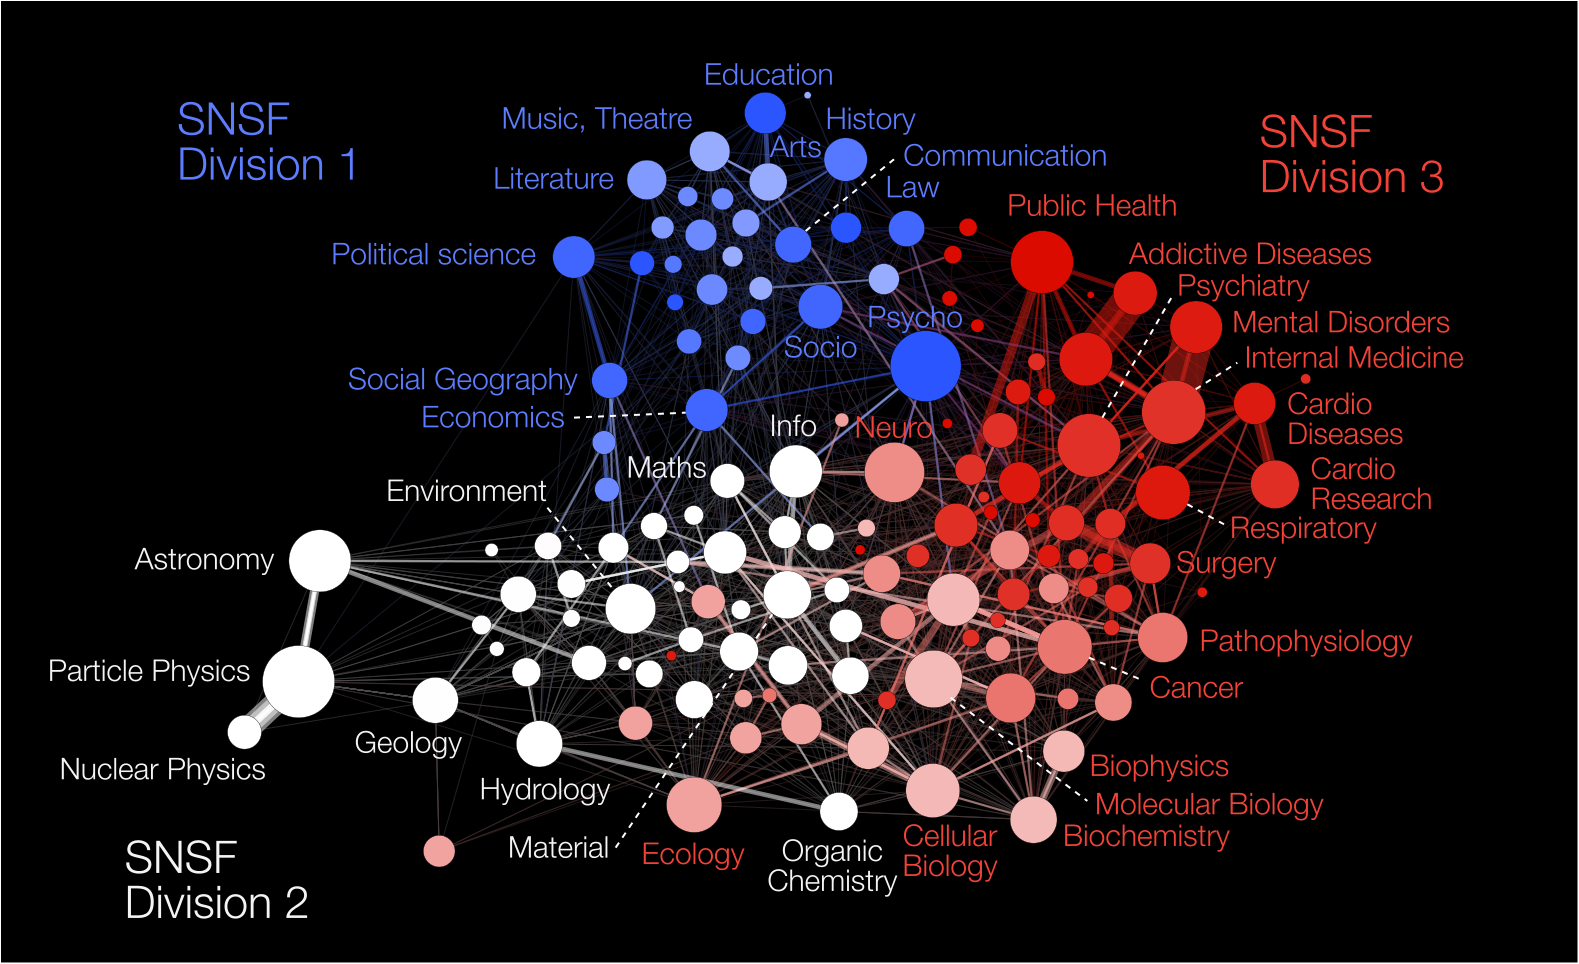
The map of the disciplines, extracted from the previous graph. Two disciplines are connected if their projects involve researchers from each other.
PERSPECTIVES
With the information contained in the list of projects, we see that it is possible to assign individuals a disciplinary category extracted from the projects involving them. As it happens that a researcher is participating to projects labelled in different disciplines, this approach will lead to a reflexion on the measurement of interdisciplinarity within a comparative study between a selection of “open” and “closed” disciplines. This is then compared with the discipline of their department, to show the difference between official affiliation and actual scientific activity.
Still a lot to do, we’re working on it!
Trackbacks/Pingbacks