

HISTORICAL “NETWORKS”
Confronted with the massification of data and embracing ever more global questions, the history of international organizations is concerned with increasingly complex objects. And if the term “network” is widely used in historical research, it is because it seems to be effective to describe these tangled, evolutionary and multi-level structures. Based on an analysis of tens of thousands of archival documents of the League of Nations’ “Intellectual Cooperation” in the 1920s, this article questions the value of formal network analysis and data visualization as an exploratory tool. From the network used as a metaphor to the complex network of archival metadata, through the network drawn on the basis of informations found in heterogeneous sources and the network extracted from the contents of the documents themselves, this article establish a typology describing four levels of network formalization and shows how these levels can be articulated. You’ll find the paper here:
| Grandjean Martin, Analisi e visualizzazioni delle reti in storia : l’esempio della cooperazione intellettuale della Società delle Nazioni, Memoria e Ricerca, 25, 2, 2017, 371-393. 🇮🇹 Italian original paper ( PDF) |
A TYPOLOGY OF USES
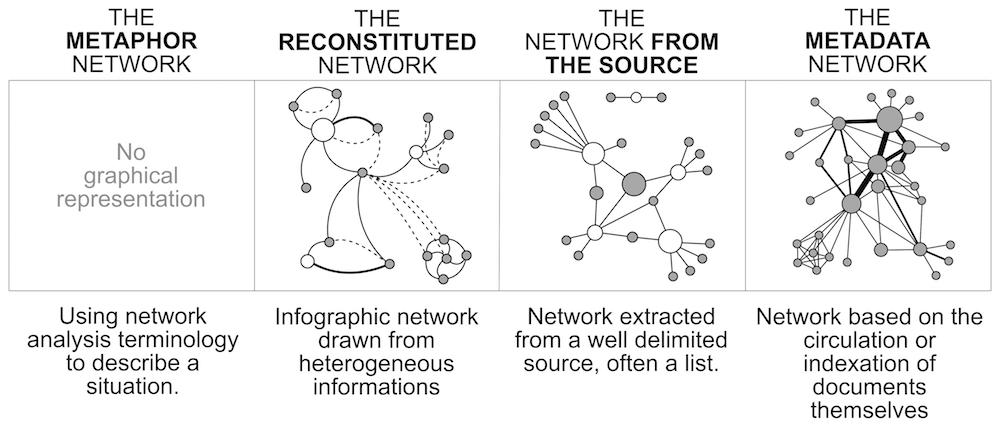
Here’s, a very (too) quick overview of the 3 main categories:
The reconstituted network

The “reconstituted” (or “drawn”) network is an infographic, information translated into an image having the visual characteristics of a network. So it is not a data visualisation – since there’s no systematic work on the data and the result is not the product of a computation – but a drawing that will be useful to understand easily or quickly a complex situation. The result is therefore the product of the interpretation of multiple sources, generally secondary and heterogeneous, from which the historian obtain bits of complementary information: the compilation of these bits in a single graphic representation will make the relations between its elements more understandable. Often, it is a deliberately simplifying image for explanatory purposes. In termes of structure, the reconstituted network is likely to be a tree structure, a flowchart where hierarchized elements have more vertical than horizontal relations or a very small social network.
Our example here is the organization chart of the League of Nations in 1930 based on dozens of reports.
The network from the sources
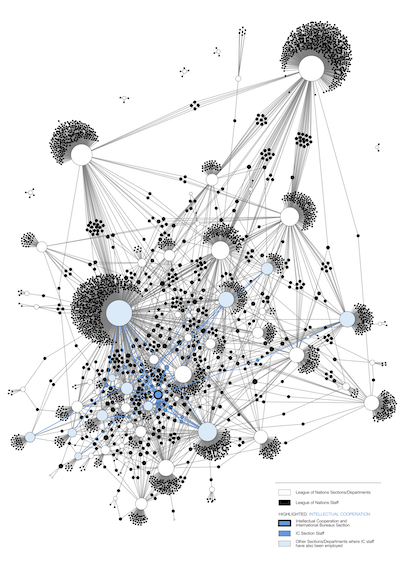
The network “from the sources” is no longer about collecting various information to reconstitute a network little by little but about drawing the graph directly from the contents of the documents, often serial sources or homogeneous corpora: lists of members of political movements, family registers, stock exchange tables, company directories, etc. This approach involves a strong act of modelling: a choice in the type of relationships we want to analyse. We no longer collect all possible types of relations between a group of individuals but we focus on a well-defined relationship which will allow a formal analysis.
Our example here is the mapping of all League of Nations employees according to their department(s) between 1919 and 1939.
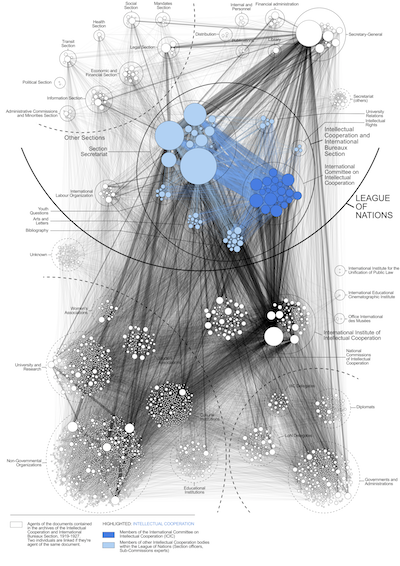
The metadata network

The last stage of our typology concerns networks that are no longer derived from the content of the sources but which map the circulation of the sources themselves. To be interested in the metadata of a document is to consider that it is possible to assume that it, whatever its content, is the testimony of a relationship between individuals or institutions. The metadata networks make it possible, for example, to replace an exchange of correspondence between two people in the context of all the exchanges that they maintain with other correspondents. This “distant reading” is a means of comparing the concrete structure of their exchange with the apparent and official structure that hierarchically or symbolically governs the relations between these individuals.
Our example here is the co-indexing network of all the actors of the documents of the International Committee on Intellectual Cooperation of the League of Nations between 1919 and 1927.
IMPROVING THE ANALYSIS BY COMBINING SEVERAL TYPES
The three levels of formalization presented above can be applied to the same historical object and thus bring complementary points of view. But they can also be grouped in a single multi-level visualization. When analyzing a complex international organization, the circulation of documents can be compared to the formal affiliation of the individuals concerned. These people can also be organized according to the “institutional geography” of the institution which makes it possible to see the relations between the different poles more explicitly than in a “hairball” network.
Our example here is the metadata network (3rd above) mapped according to the organisation chart (1st above) with individual affiliated according to the 2-mode network (2nd above).
Read more in the paper (and tell me what you think about it)
See also: Grandjean (2017), Multimode and Multilevel: Vertical Dimension in Historical and Literary Networks, DH2017, Montreal.
Very interesting and beautiful work! I really enjoyed reading your conference paper on this topic as well.
One quick question: for the combined multi-level visualization, are you creating the graph with a force-directed layout in Gephi, and then manually drawing the circles for the institutional geographies over it, or is there a way to draw these circles from within Gephi?
I have a co-authorship network that I would like to incorporate some of these multi-level visualization techniques into, but am not sure the best way to approach it.
Hi Steve, many thanks for your interest. The process is a kind of “hack” of the GeoLayout Gephi plugin: you assign coordinates to the nodes in a kind of “topography” you’ve decided first, to group them according to the institution/group/etc. And then you use the NoverLap layout algorithm to give the nodes more space and form these clusters. But then, you’ve to export your result in SVG and draw the circles, caption, etc. on your own.
Does it sounds clear? Let me know if I can help you.