
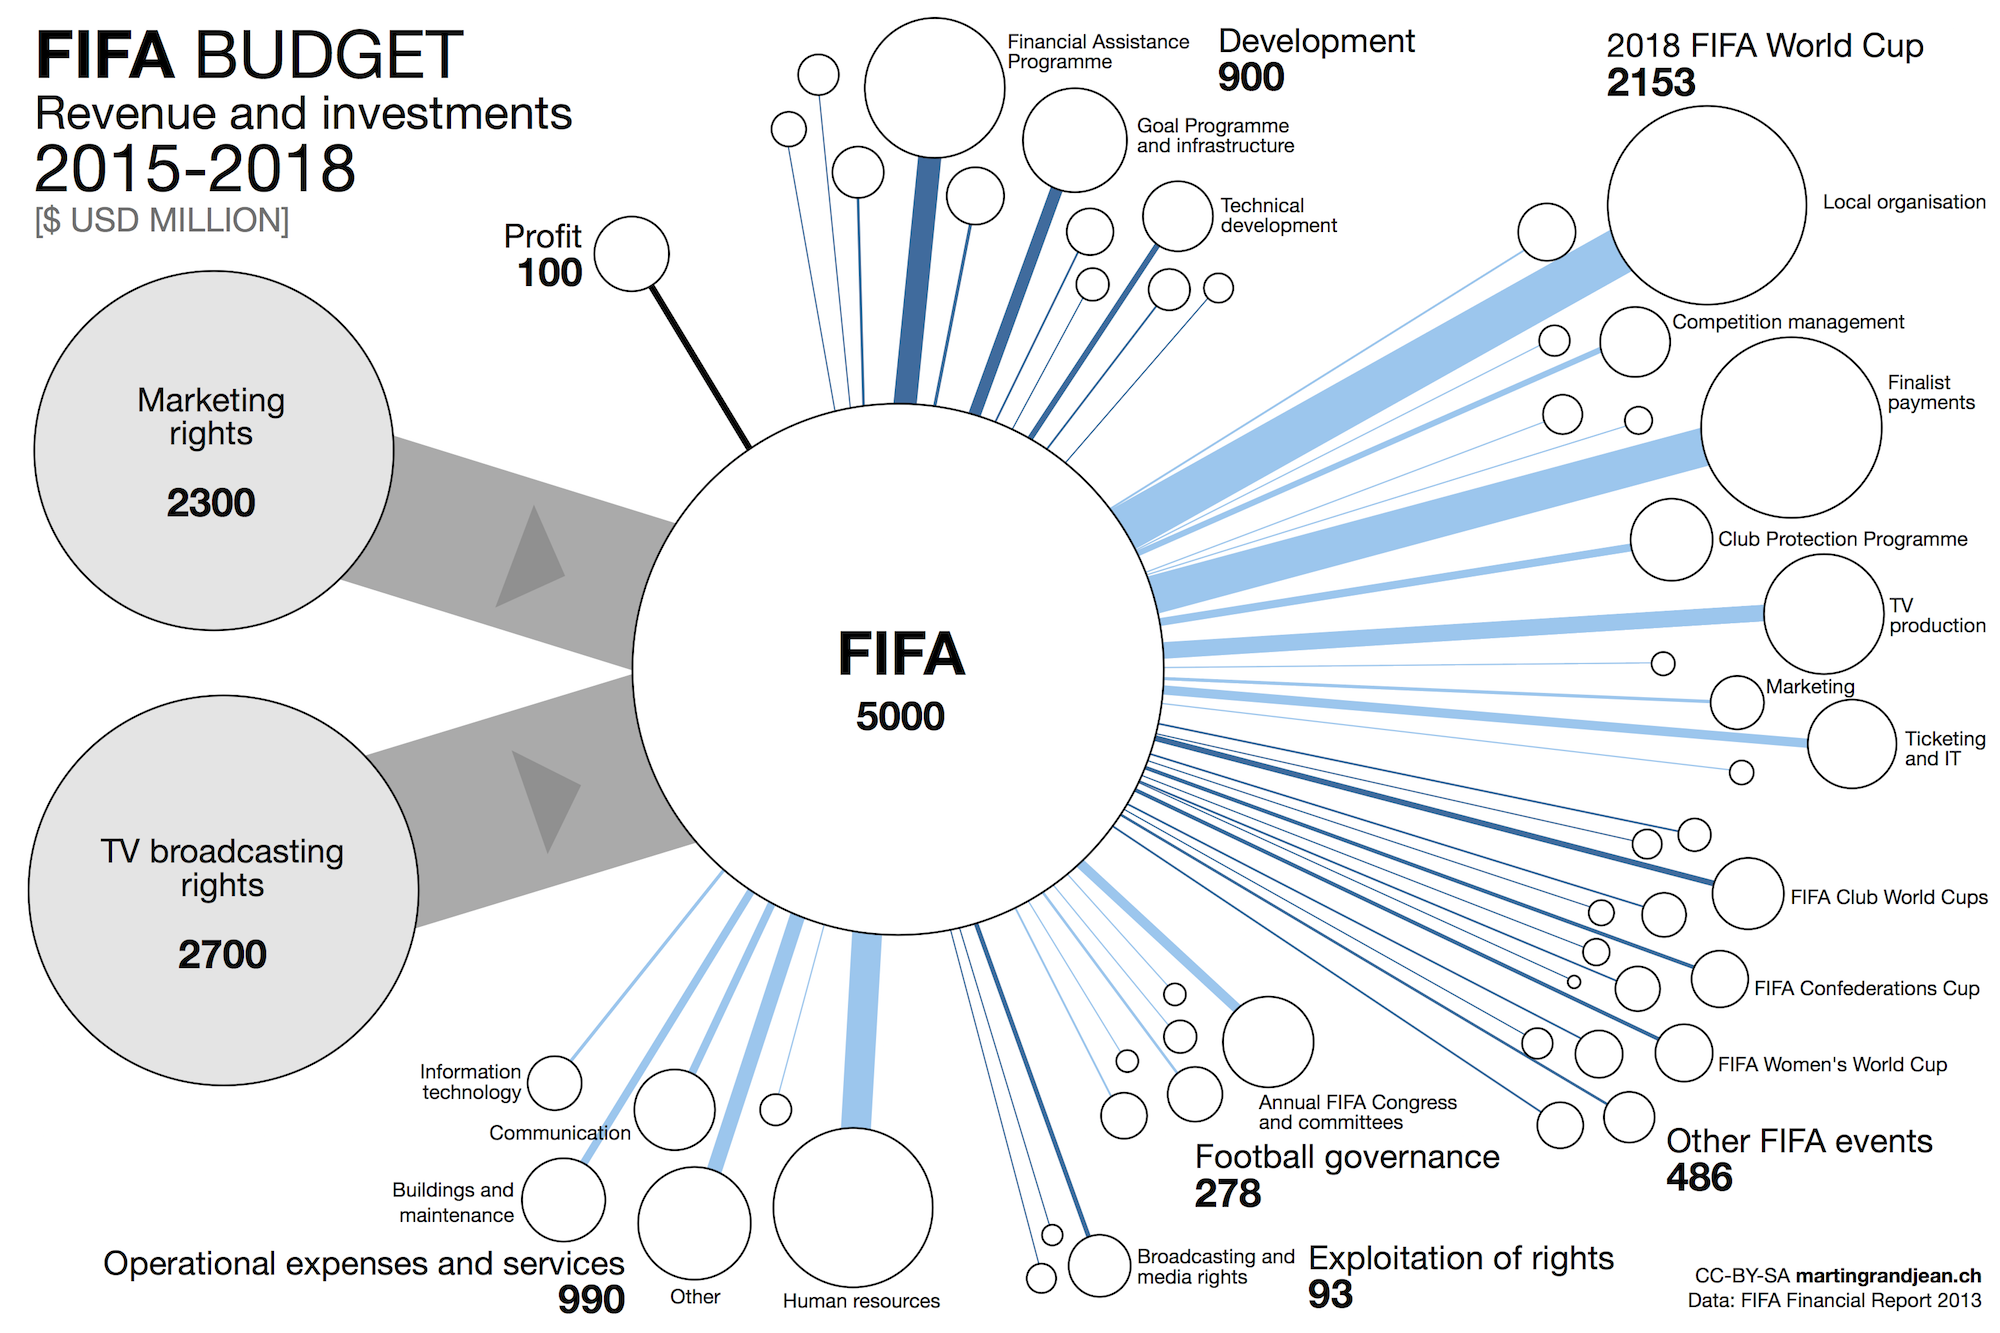
The four-year FIFA financial strategy is based on the World Cup, his main source of income. While the arrest of seven executives led FIFA in a new crisis, this graph provides a quick and overall state of the finances of the football federation.
Key: two gray circles left = revenue, other white circles = investment/expense
Full screen here. CC-BY-SA license – freely reusable with link to this post.
[threecol_one_first]
REVENUE
The revenue include the marketing rights ($2.3 billion) and the TV broadcasting rights ($2.7 billion).
INVESTMENTS
43.1% of the 2015-2018 investments concern the 2018 FIFA World Cup (9.7% for the other competitions).
RESULT
The projected result is a profit of $100 million.
[/threecol_one_first][threecol_one]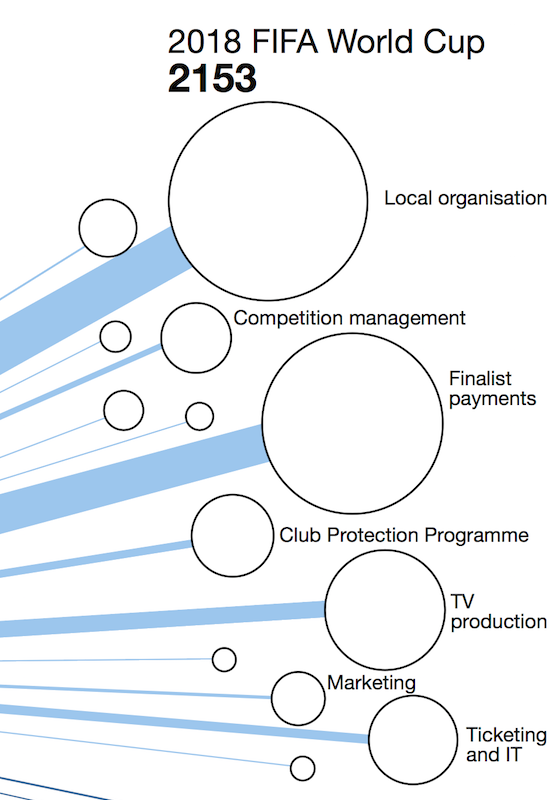 [/threecol_one][threecol_one_last]
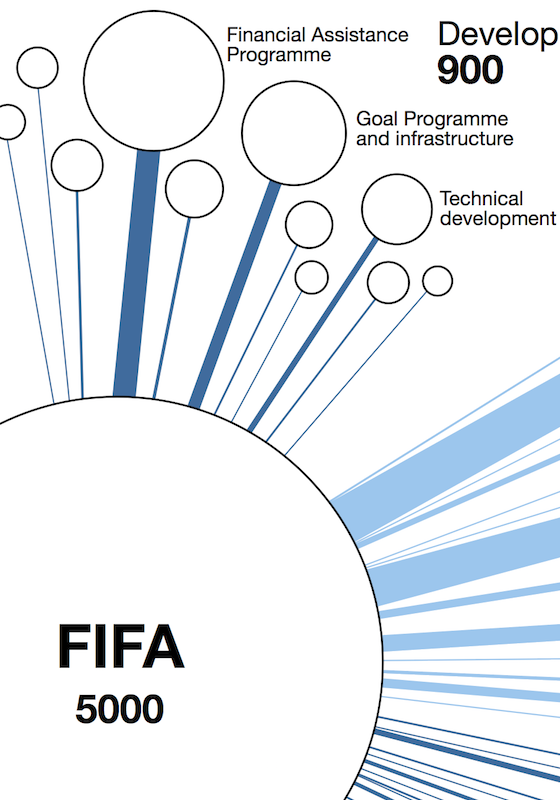 [/threecol_one_last]
Source: FIFA Financial Report 2013 (online)
Trackbacks/Pingbacks