
A map of the distribution of international congresses with a focus on Europe (between 1840 and 1960, 6 congresses out of 7 took place in Europe). Scale: Paris=1092; London=546; Berlin=188. CC-BY-SA Martin Grandjean 2019
[fivecol_three_first]
MAPPING INTERNATIONALISM
Data collection
In a world today accustomed to multilateralism, where a “world parliament” – the United Nations Assembly – deals with all issues requiring international cooperation, “international congresses” (meetings of diplomats or experts around a very specific political, technical or ideal issue) seems to be the legacy of another time. And this is the case: international congresses are a form of meeting that date back to the mid-nineteenth century. A time that precedes and prefigures the first life-size experiment of a global multilateral organization: the League of Nations.
There are congresses of all kinds: to co-ordinate postal systems, to standardize measurement units, to develop international legislation, to regulate security issues, to combat the spread of epidemics, etc. A true “Belle Epoque” of internationalism which culminates in 1900 at the Paris World Fair. And among all the organizations that are being created around these more and more numerous and regular events, the Union of International Associations (UIA) is founded in 1910 in Belgium to create bridges and to identify all these activities. It is on the basis of its censuses that we publish today, as part of book on the UIA , a kind of data-paper on congresses and non-governmental organizations of the nineteenth and twentieth century , written with Marco H. D. Van Leeuwen.
Visualization
The visualization proposed in this post is an experiment based on the notion of “heat map“, to try to overcome the problems of an overly precise cartography and to make the global distribution more readable. Indeed, displaying one point per city creates a lot of overlap, and the “cartogram” approach of fig. 11.2 below is not perfectly readable. This “density” map shows very well the trio of global capitals (the “cosmopolitan triangle” of Paris, London and Brussels), the “European megalopolis” going from the North of Italy to Great Britain via Switzerland and the Benelux, and the secondary, outlying or “peripheral” capitals.
Beyond the map
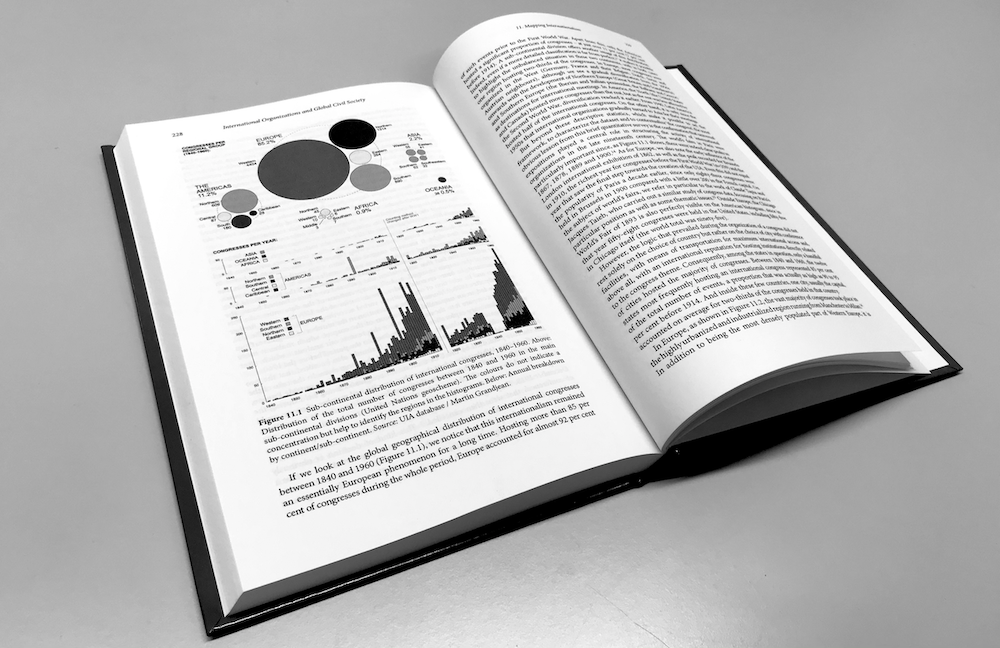
However, this map is only a kind of appendix to the article. In this paper, we propose three visualizations from the same dataset. The first shows the evolution of the number of congresses over time and their distribution at the sub-continental level ( fig. 11.1). Hosting more than 85% of congresses during the whole period, Europe accounted for almost 92% of such events prior to the First World War. Apart from this, only the Americas hosted a significant proportion of congresses – at just over 11% (7% before 1914). We also see that it was not until the 1930s that Western Europe was caught up by the other European regions.
[/fivecol_three_first][fivecol_two_last]
THE CHAPTER
THE BOOK
|
[/fivecol_two_last]
 Fig. 11.1 (p. 228) Congresses at the sub-continental level. Fig. 11.1 (p. 228) Congresses at the sub-continental level. |
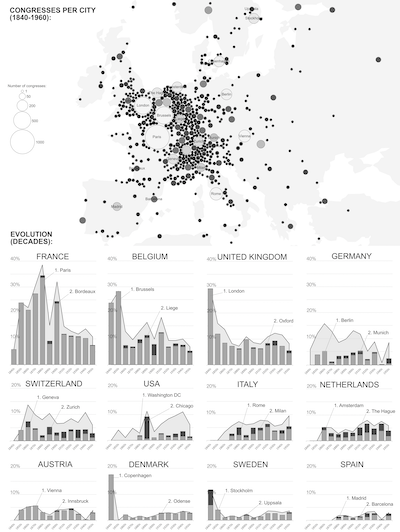 Fig. 11.2 (p. 230) Main cities within major countries. Fig. 11.2 (p. 230) Main cities within major countries. |
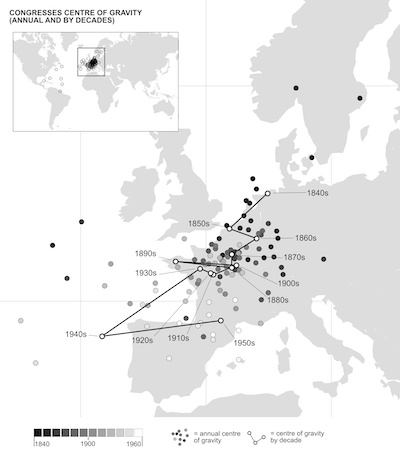 Fig. 11.3 (p. 232) Center of gravity of all congresses by year (dots) and decade (connected dots). Fig. 11.3 (p. 232) Center of gravity of all congresses by year (dots) and decade (connected dots). |
The histograms that accompany the European cartogram ( fig. 11.2) compare the values by decade for the top twelve congress host countries between 1840 and 1960 (as a proportion of the global total). By comparing the total proportion for a country (area marked by a line) with the score for its first two cities (light grey bars for the first and dark grey bars for the second), it becomes very clear that the dominance of the French capital was characteristic of states whose political, cultural and social activity was very strongly centralized. Furthermore, with these maps, temporality is an aspect difficult to combine with the spatial approach. As the global displacement is fairly invisible on a short temporal scale, we may summarize the annual ‘centre of gravity’ per decade (fig. 11.3 ). If the centre of gravity changed little between 1870 and the Second World War, the period since 1950 saw a shift towards the South. This was the result of new destinations in the Americas as well as in Asia, Africa and Oceania. However, during the 1950s, Europe still hosted 78% of all international congresses (61% for Western and Northern Europe only).
BONUS: THE ANIMATED MAP
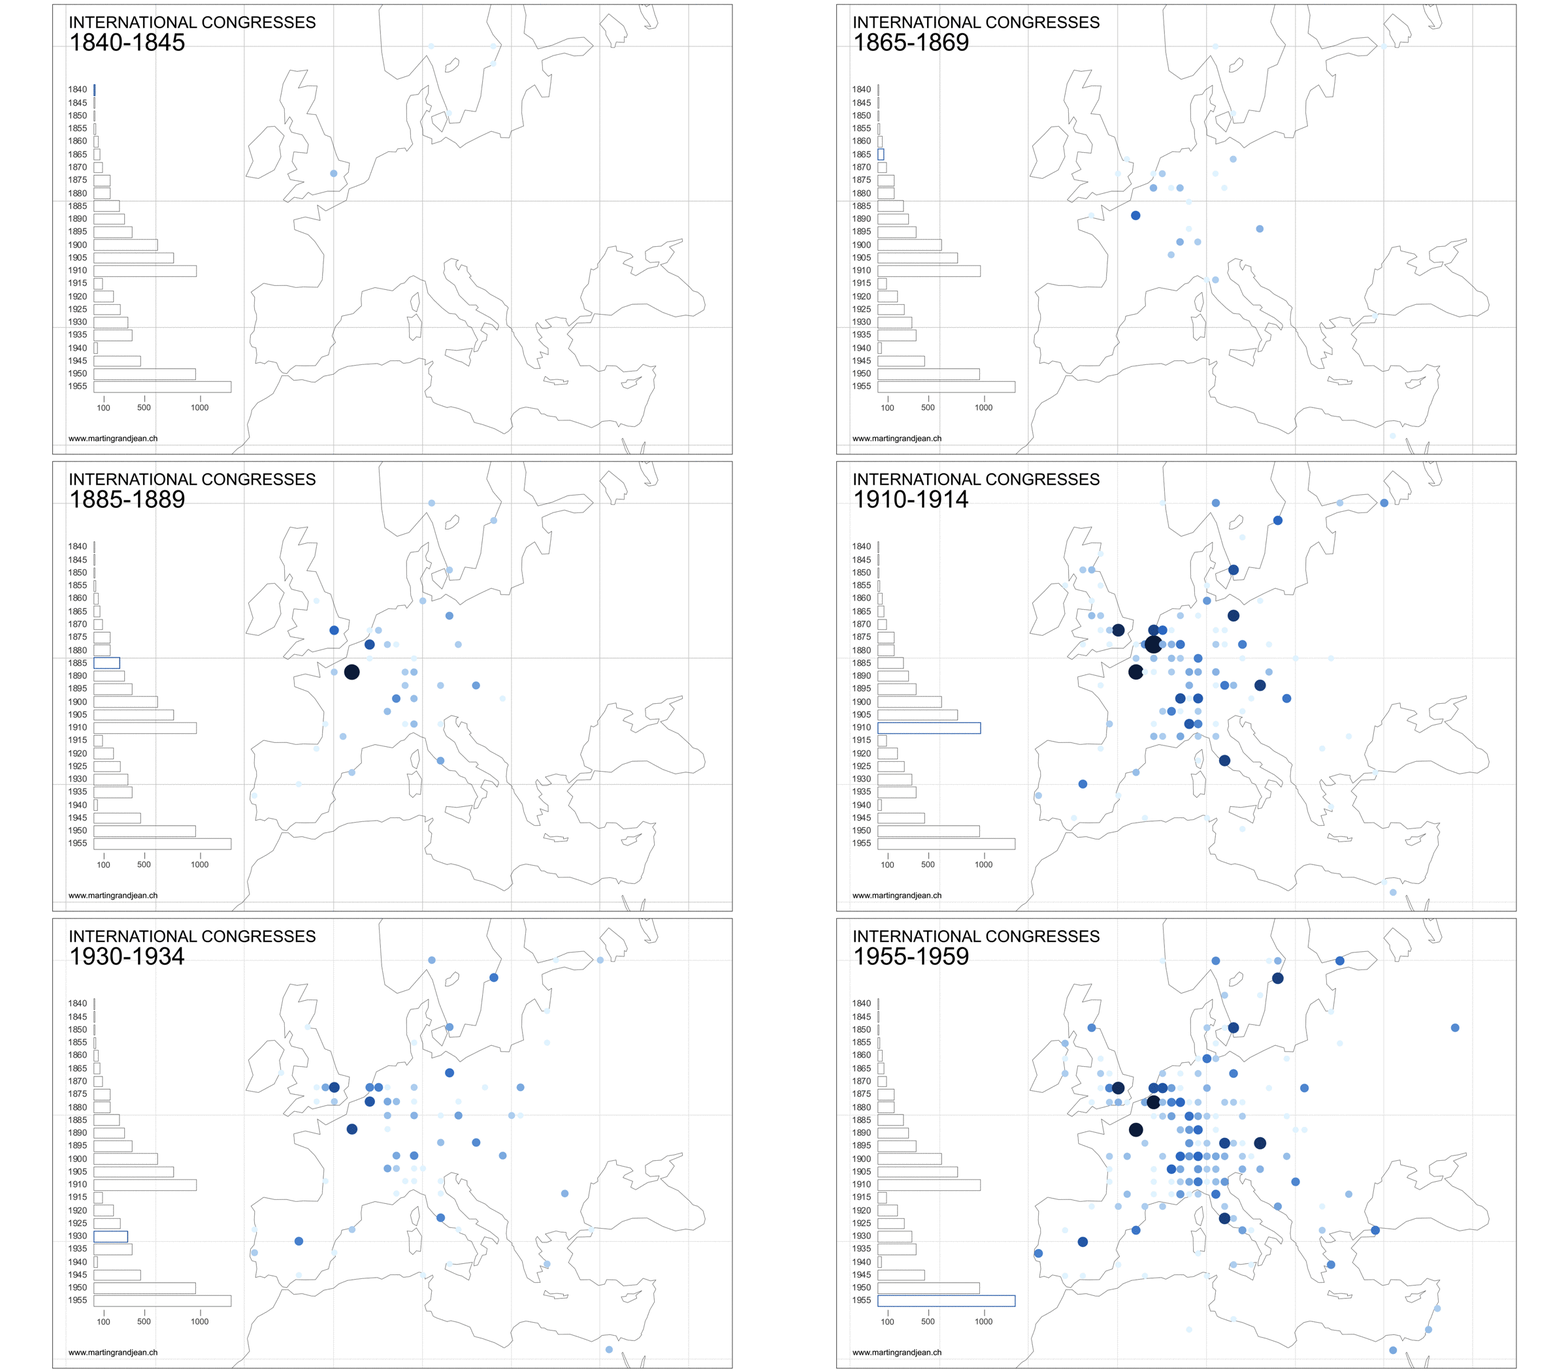
As strange as it may seem, this map has been produced with Gephi, and edited with Inkscape.


Trackbacks/Pingbacks