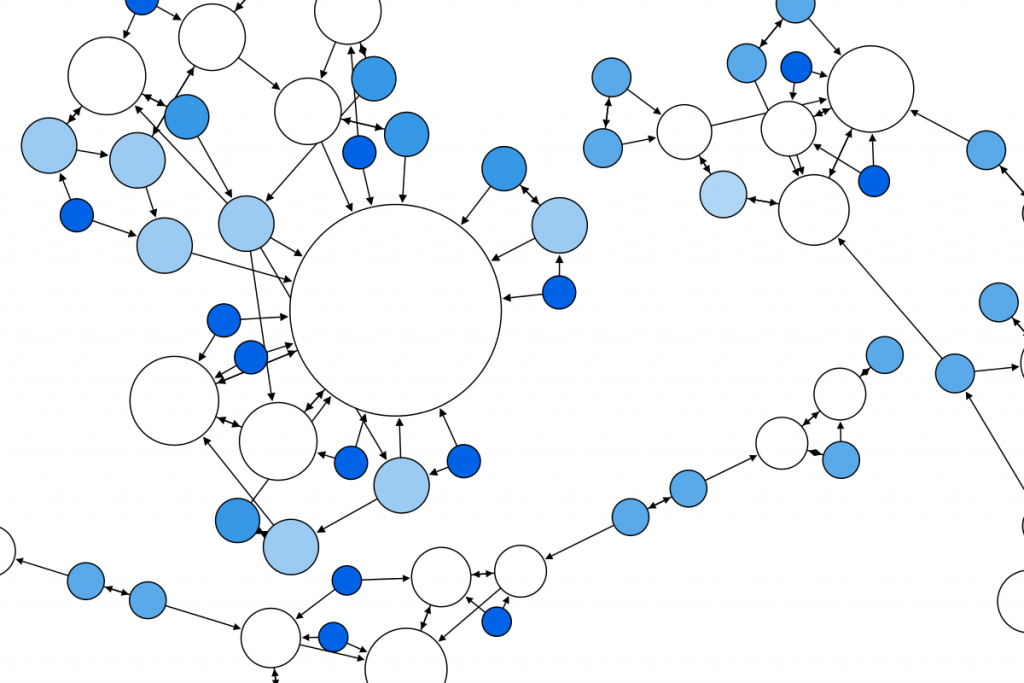
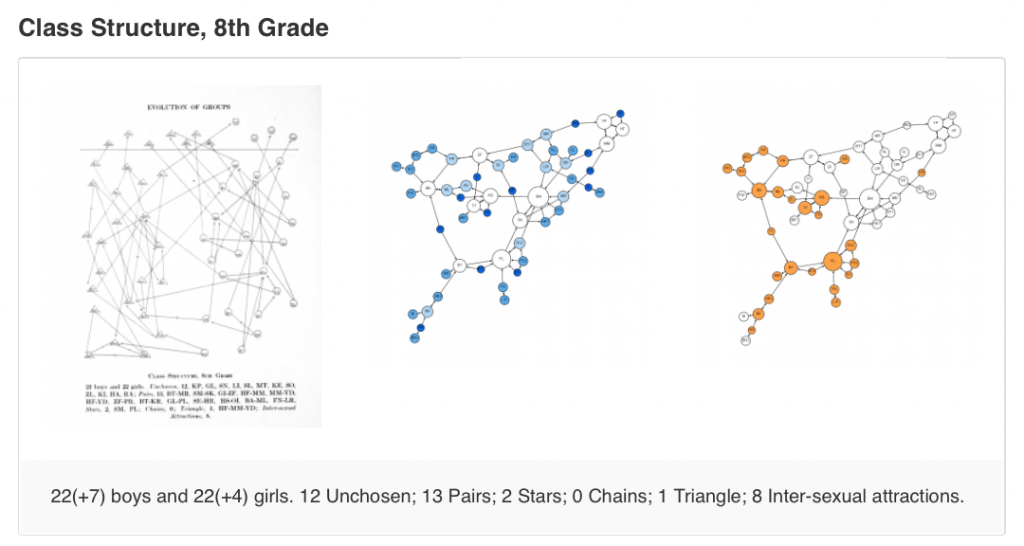
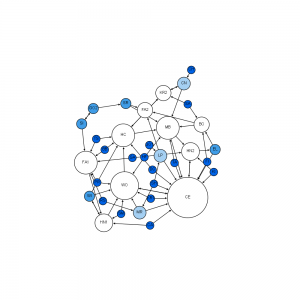
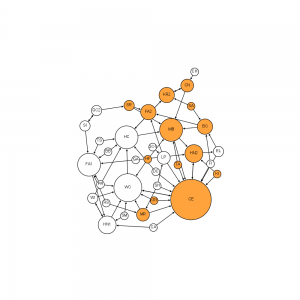
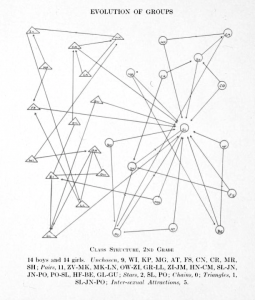
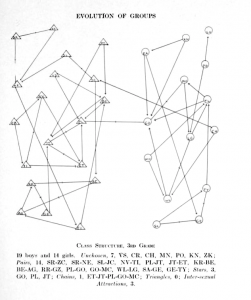
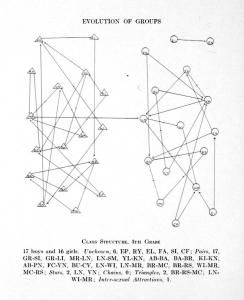
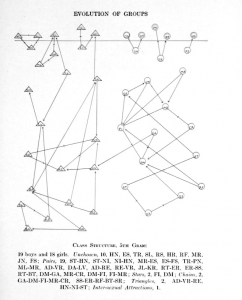
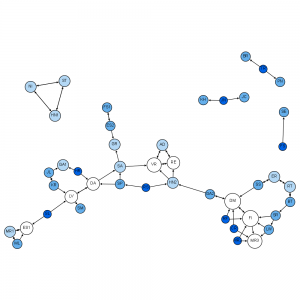
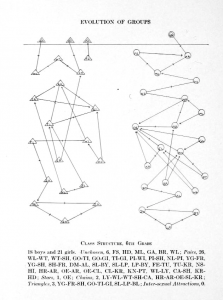
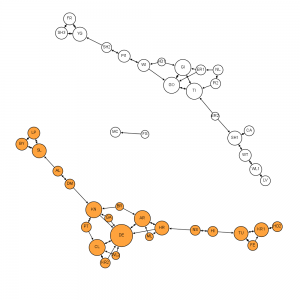
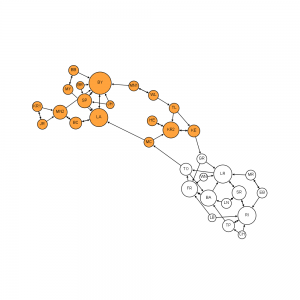
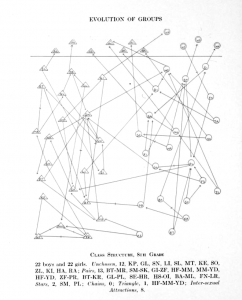
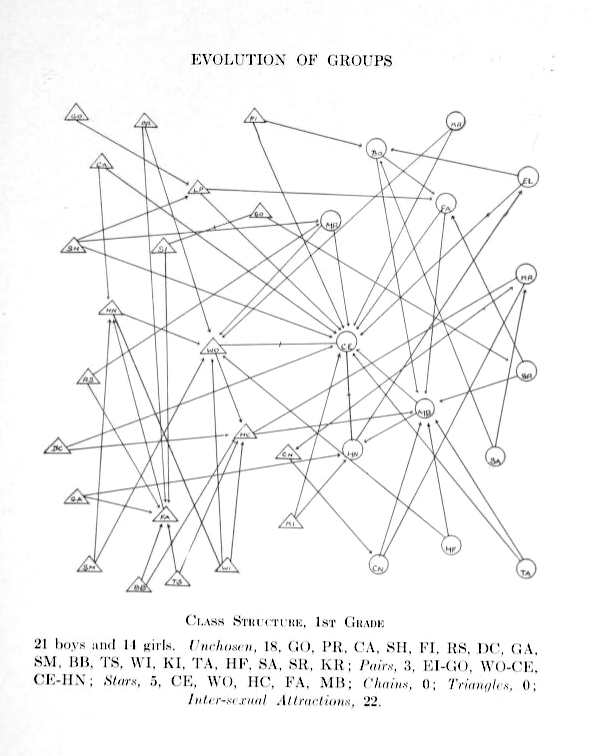
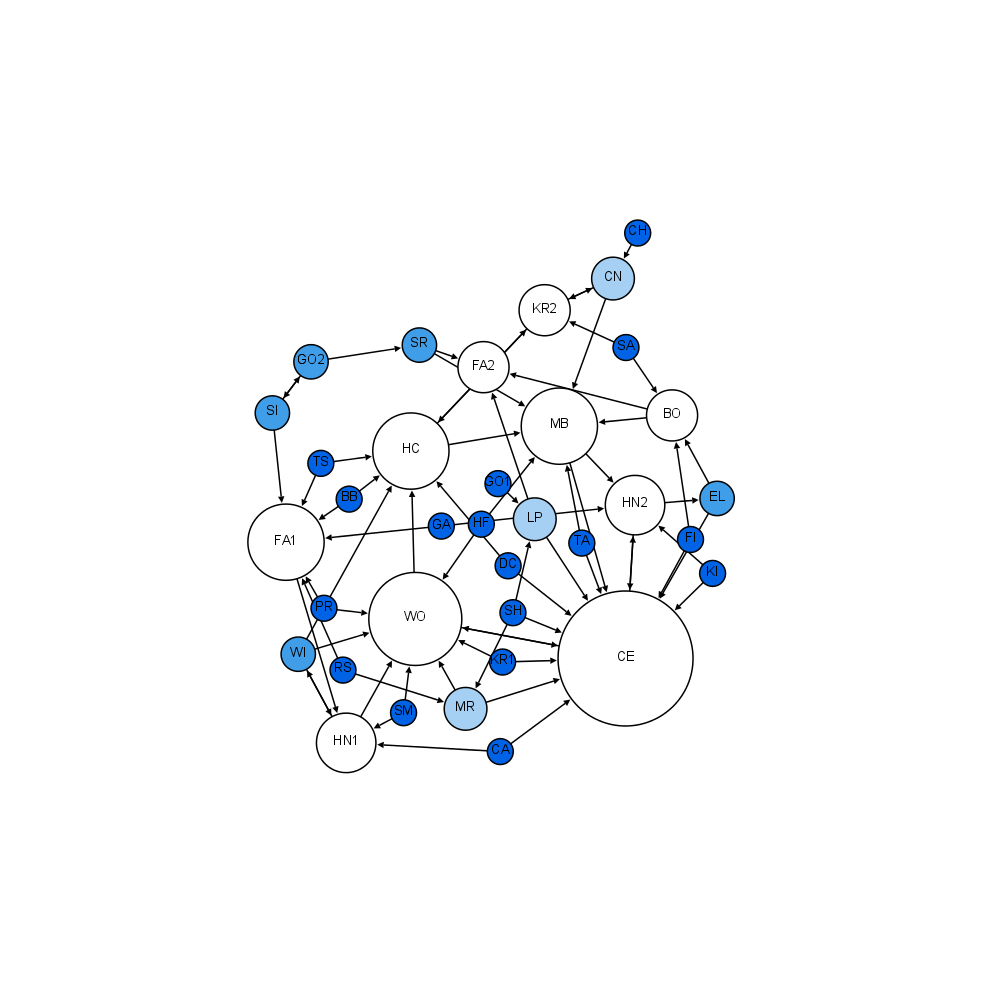
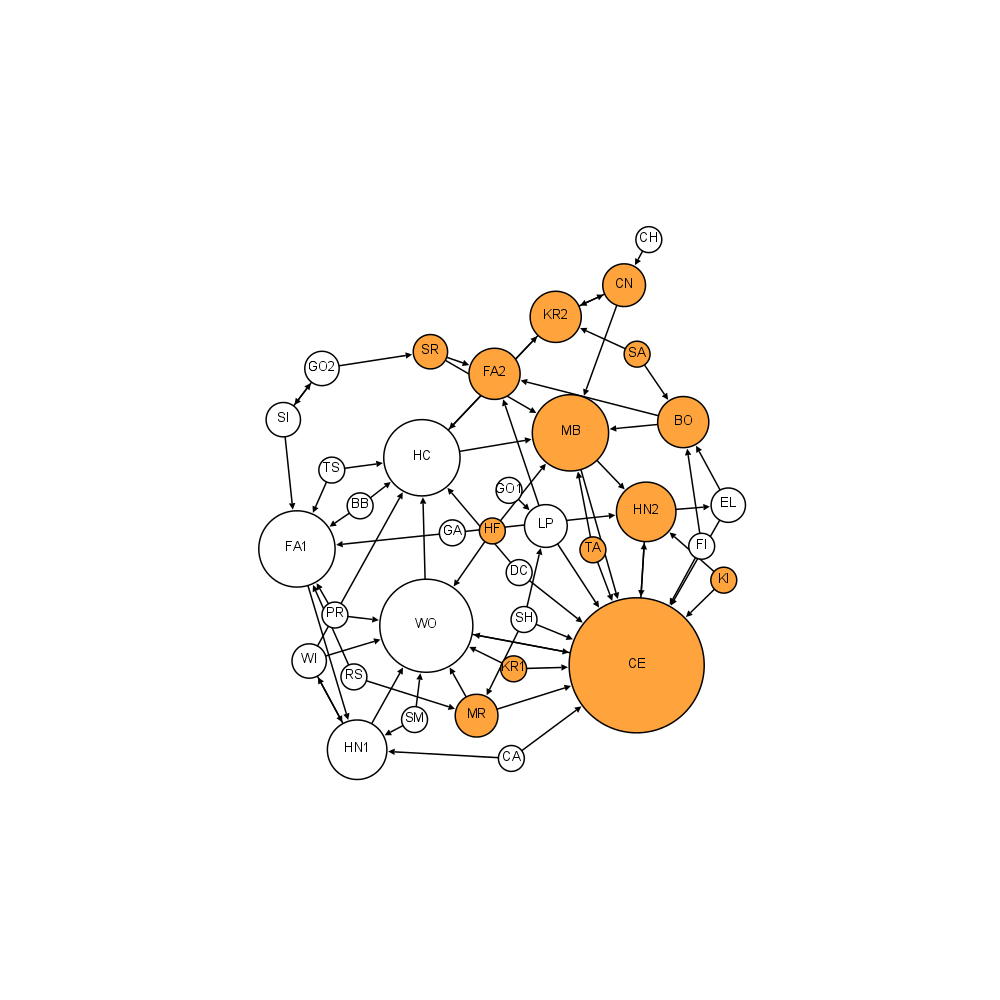
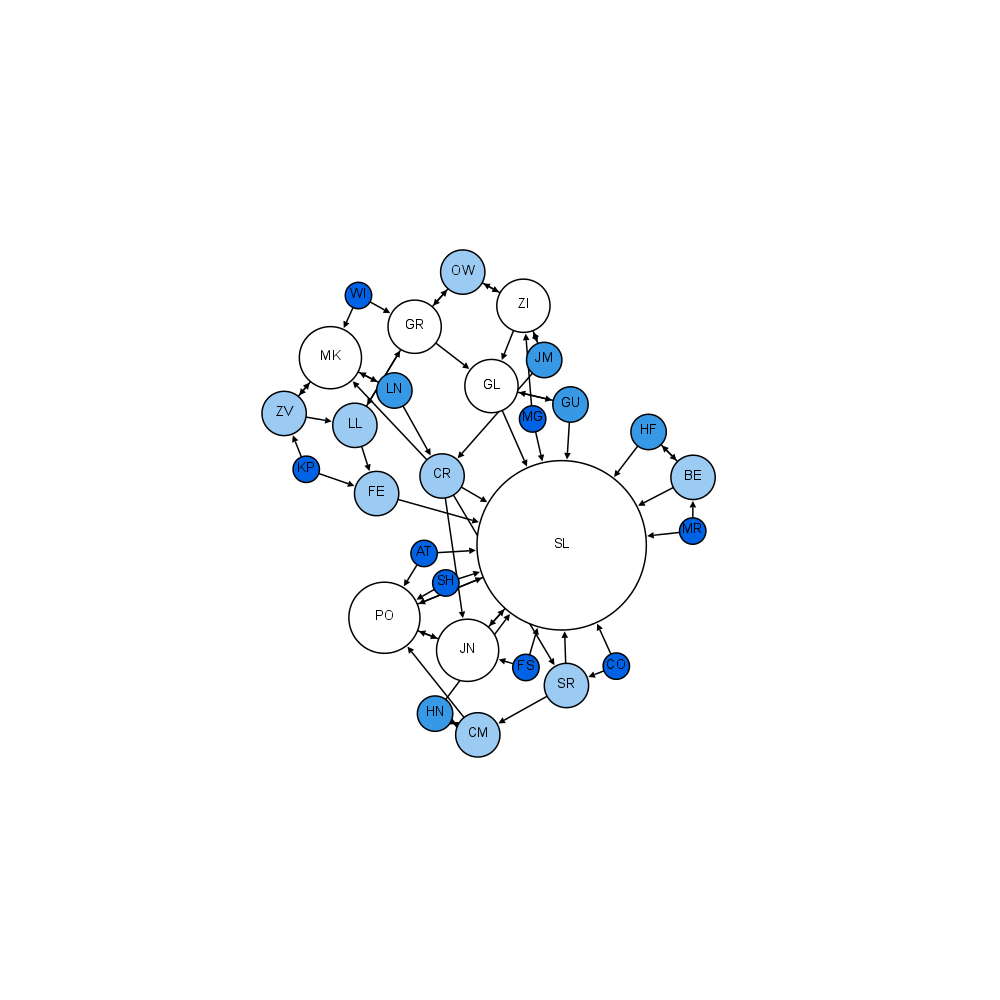
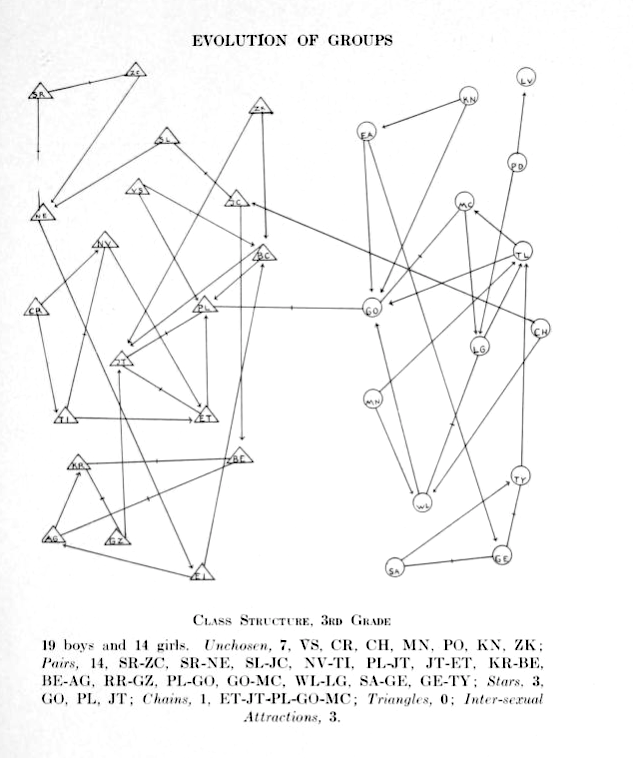
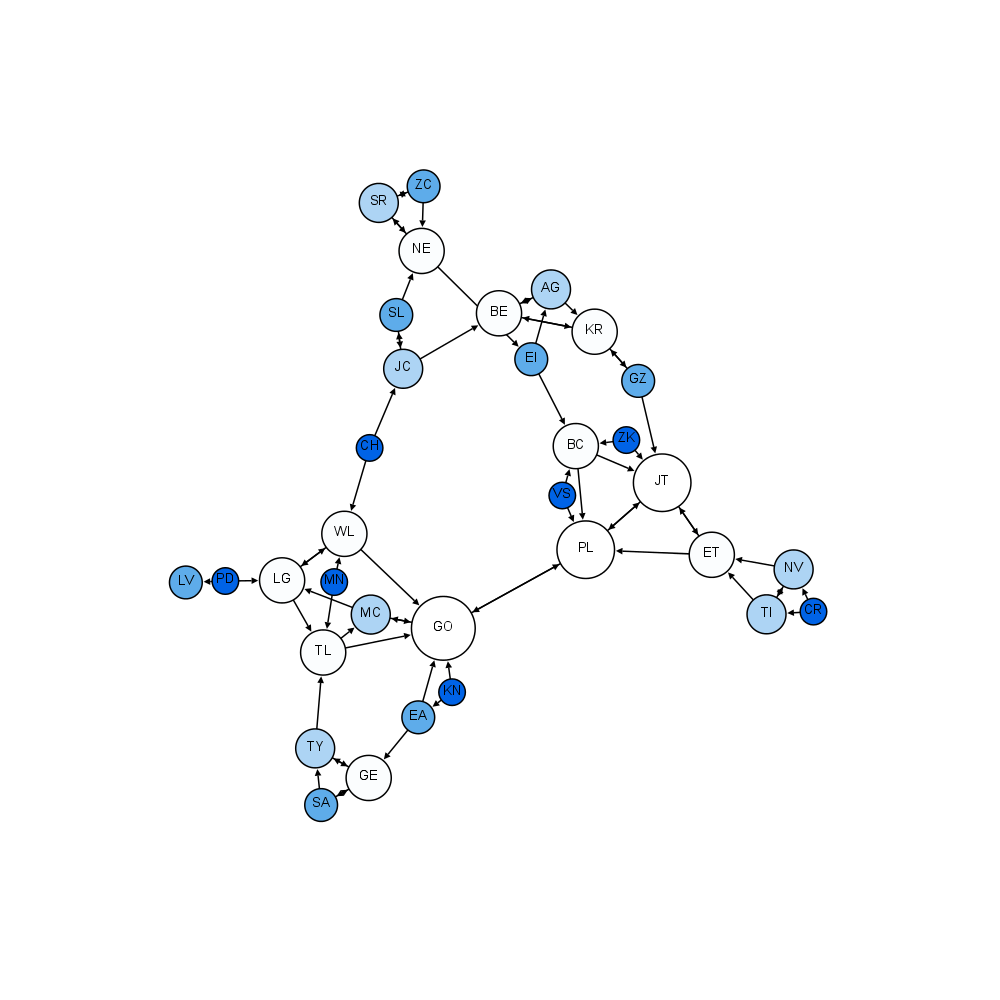
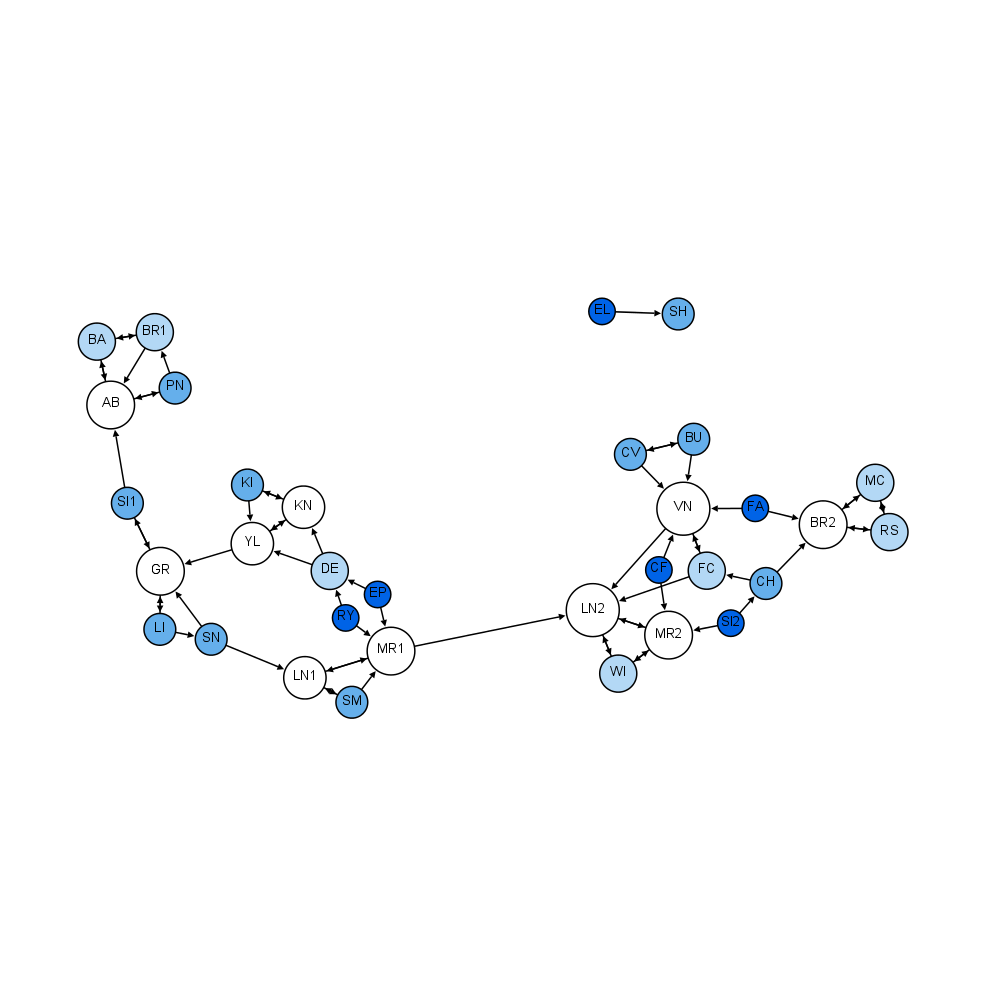
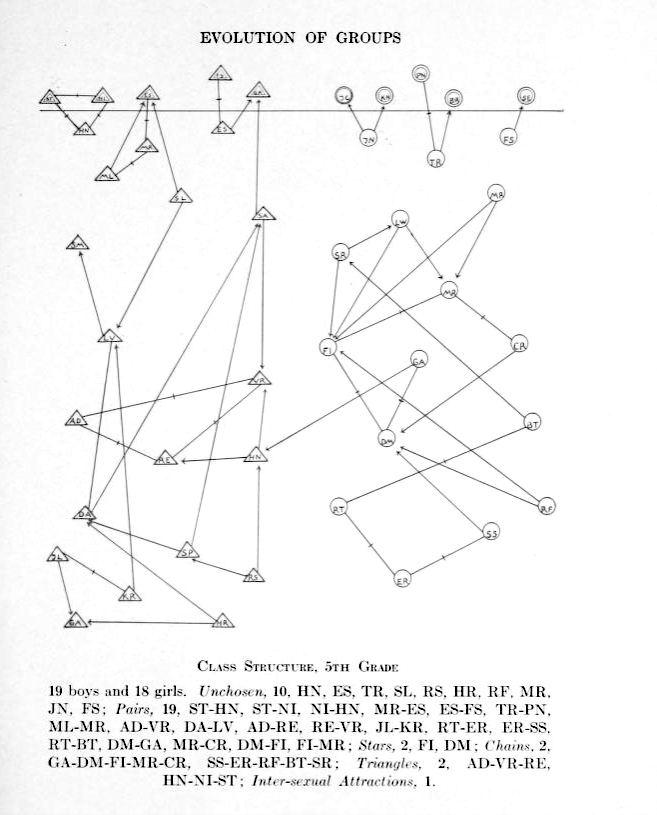
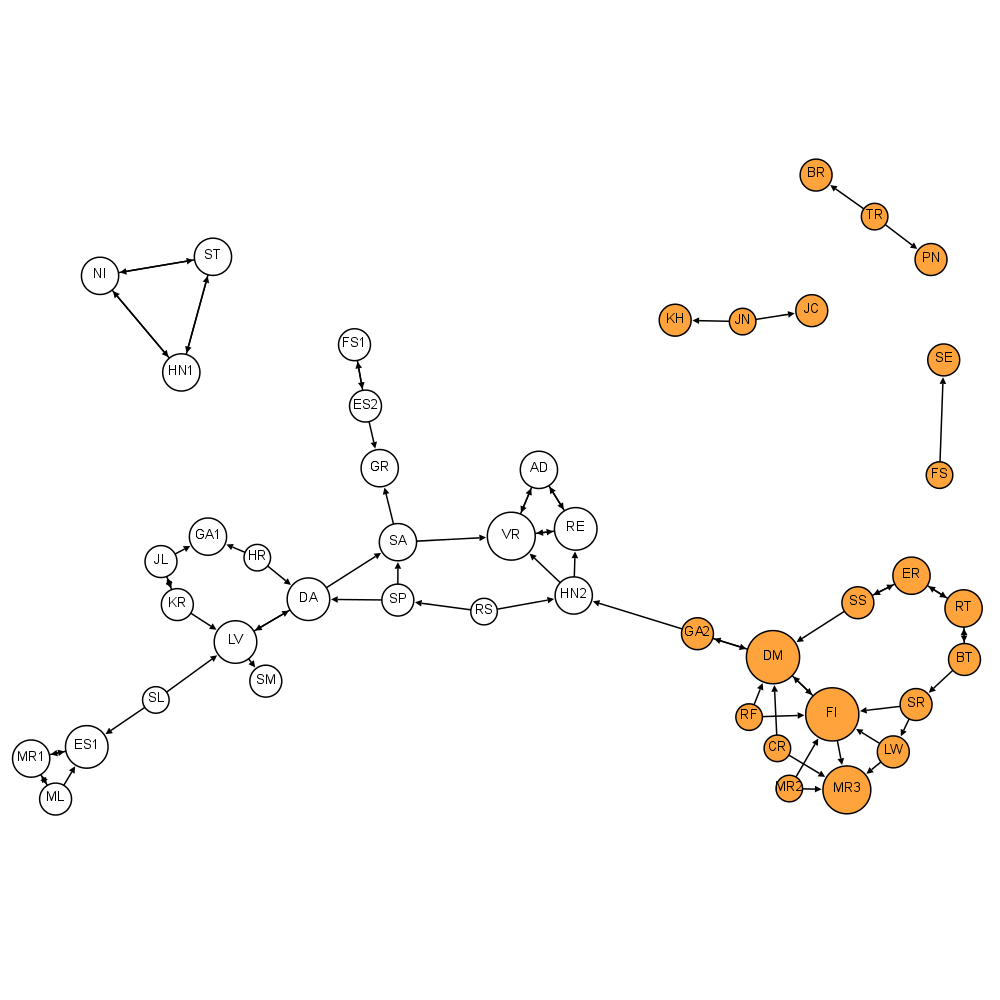
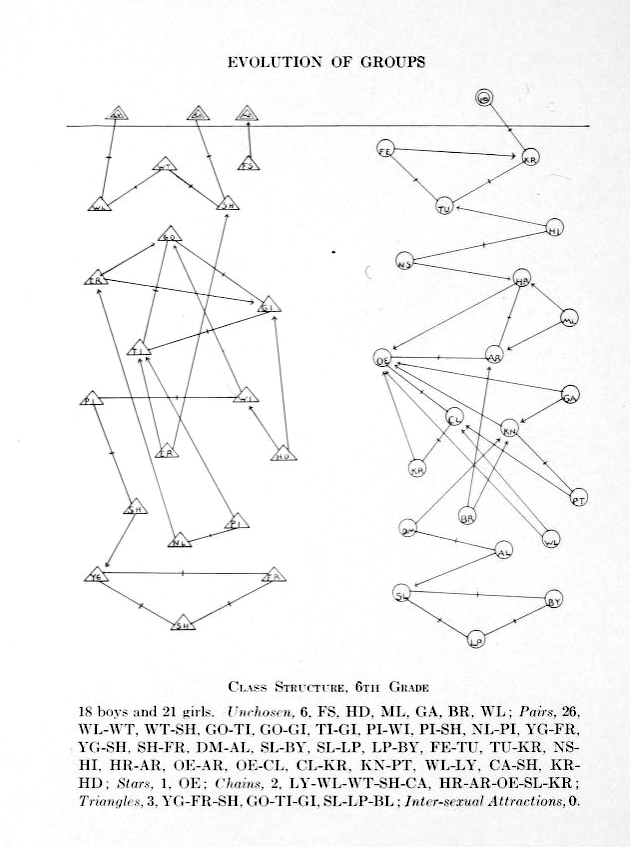
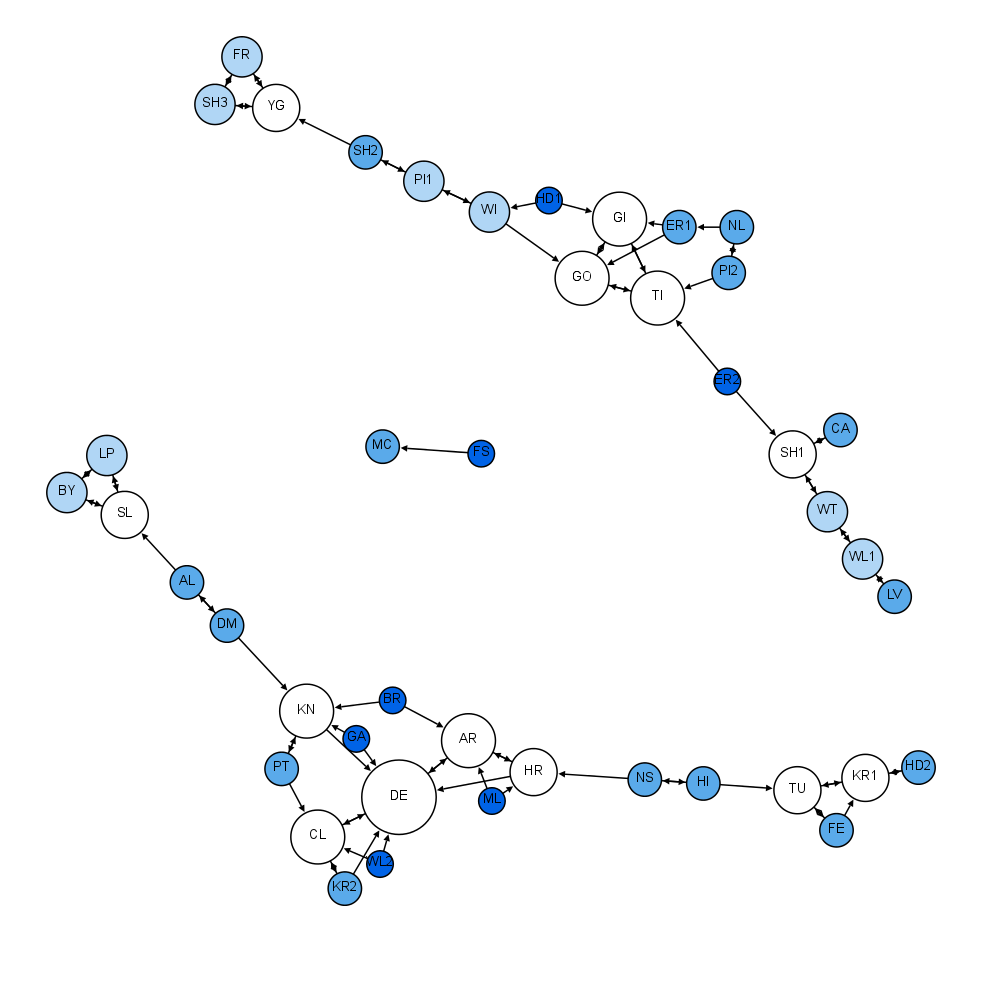
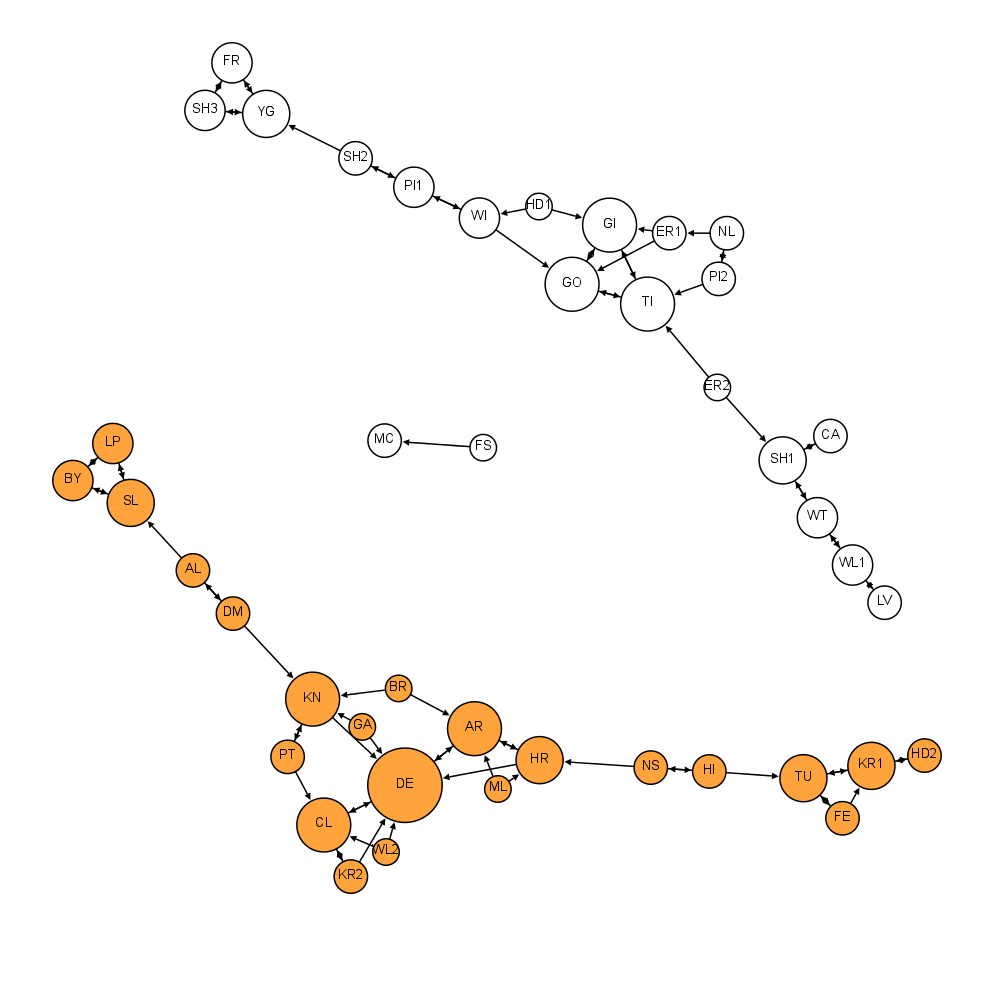
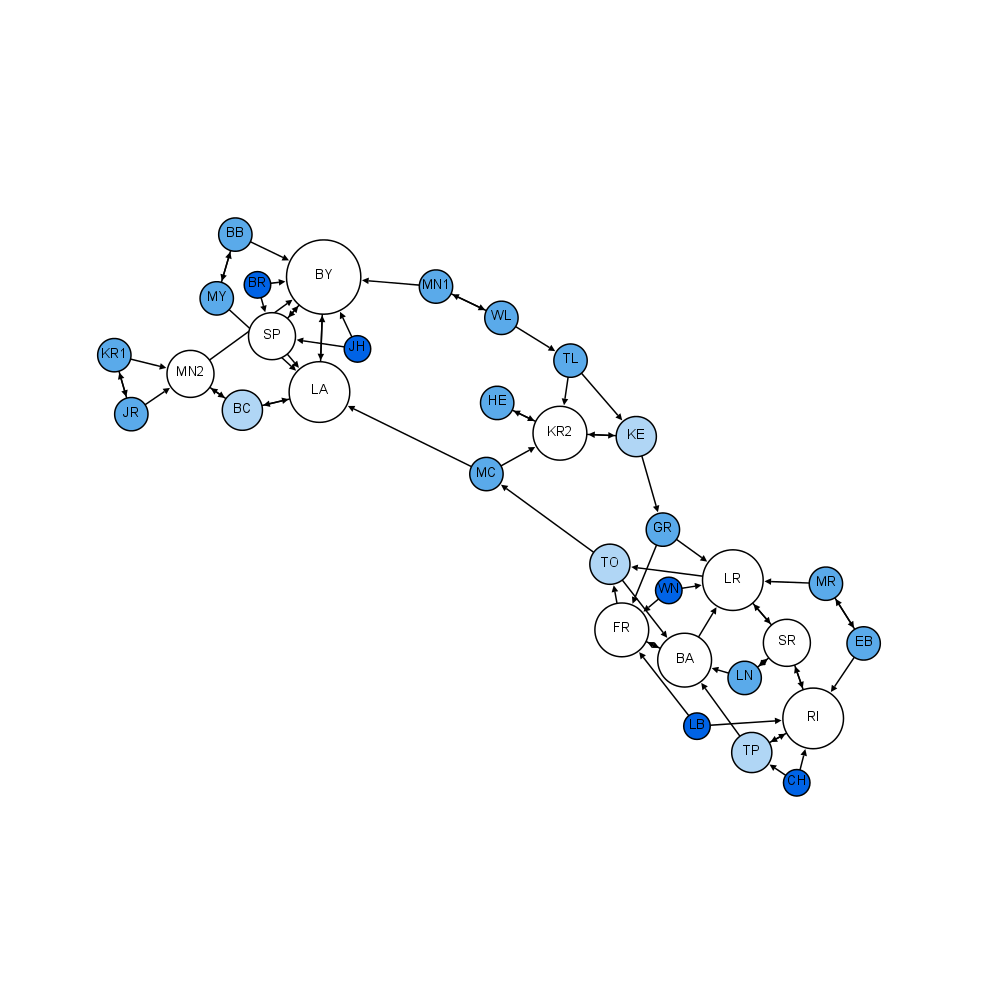
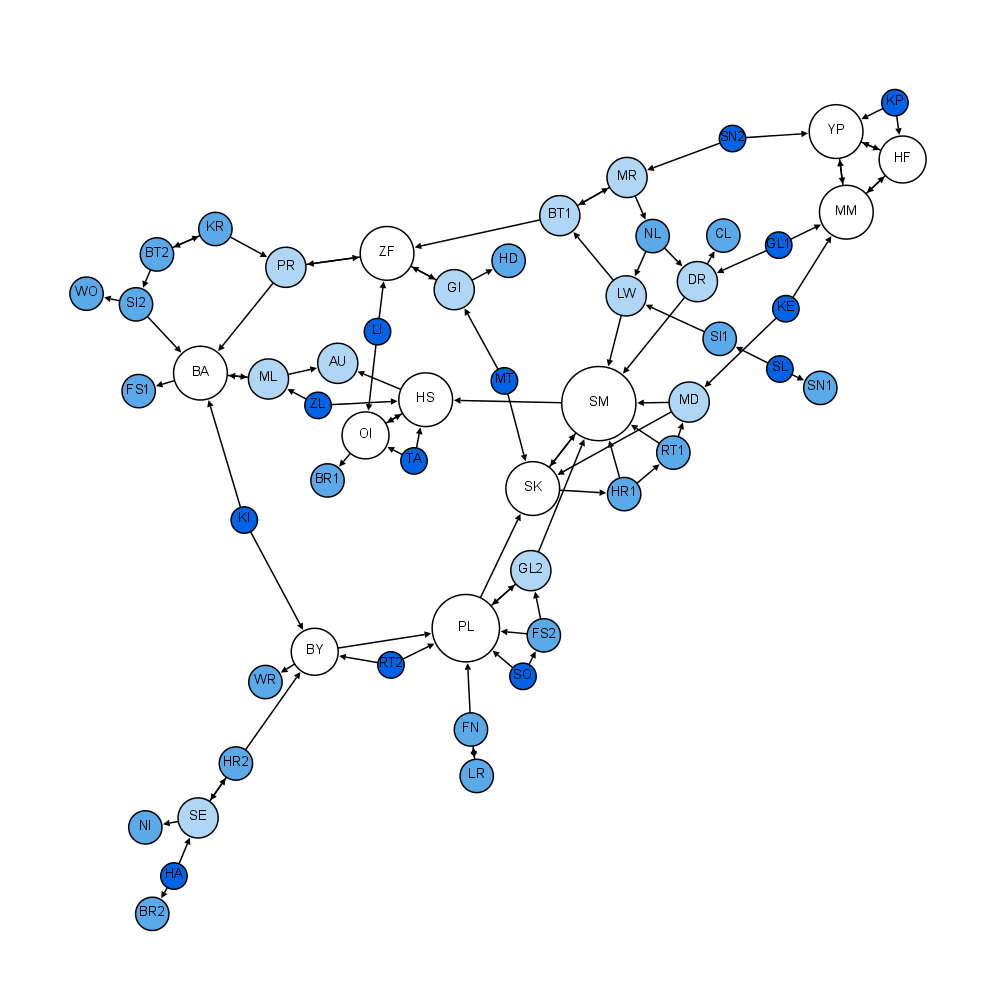
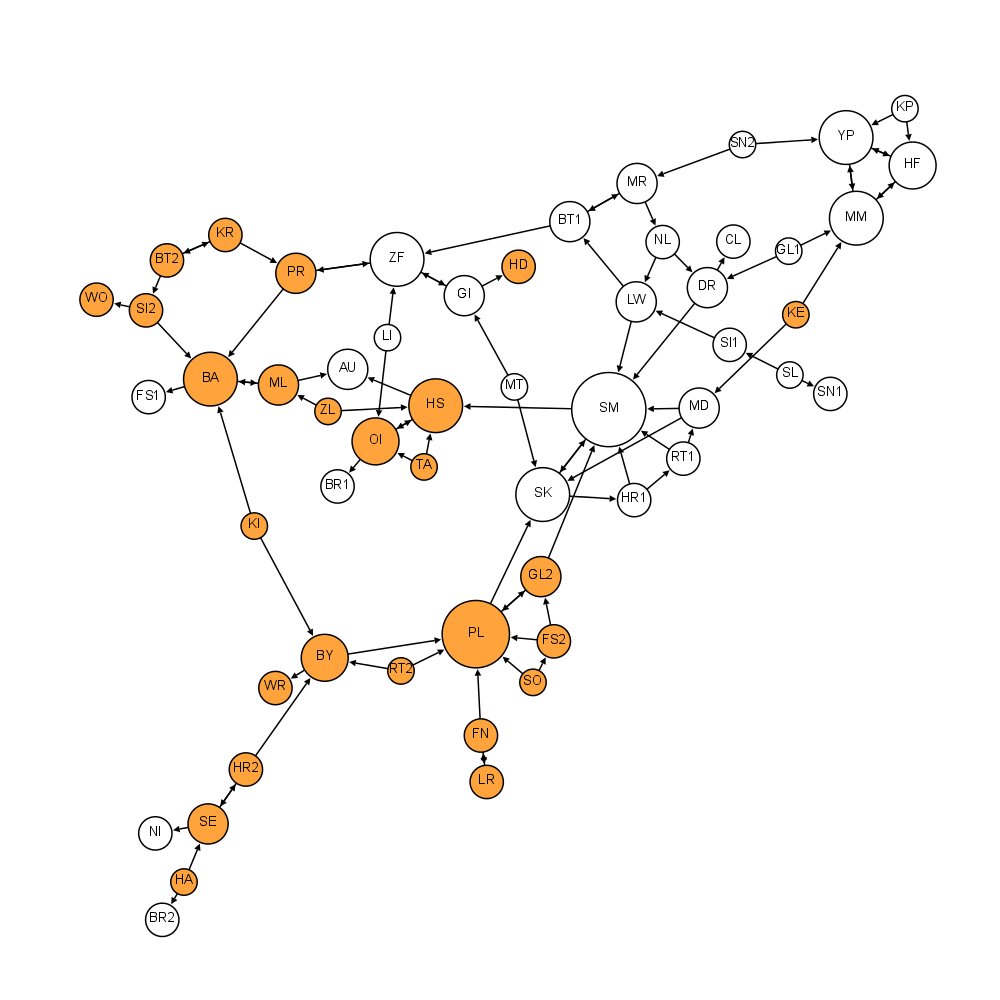
CAPTION Left: original network published in Moreno (1934) Who Shall Survive? Center: redesigned network, indicating the number of incoming connections (dark blue=0, white=3 or more) Right: redesigned network, highlighting girls (orange) and boys (white). Click on images to enlarge.
Moreno’s sociograms are frequently considered as the first examples of social network analysis and visualization. Mapping the social affinities of a group of individuals, Moreno’s first sociograms visualize the relationships between pupils in a classroom: who wants to be sitting next to whom? Each child can choose two others, for results that suggest that sociabilities are changing over time: the proportion of attractions between boys and girls decrease, community structures are formed and then disappear, etc.
Sociological and mathematical interests of this work have already been discussed in thousands of publications. This post simply questions the visual practices introduced by Moreno and compares them to a more modern way of visualizing such networks. It is clear that the hand drawing causes a visual bias, particularly because of Moreno’s decision to separate girls and boys into two predefined groups. Visualizations below, for the 8 classes (1st to 8th grade) show that this bipartition is not always justified since communities are formed inside them (the inter-sexual “bridges” between boys and girls are not the only structural bridges between cliques). We note that playing with the size and color of the nodes enables a faster understanding of the graphs structure. Also note the measures proposed by Moreno (“unchosen”, “stars”, “triangles”, etc.), which prefigure some of the metrics used today to describe networks and their components (centrality measures, for example).
Sociograms
Class Structure, 1st Grade
 |
 |
 |
| 21 boys and 14 girls. 18 Unchosen; 3 Pairs; 5 Stars; 0 Chains; 0 Triangles; 22 Inter-sexual attractions. |
Class Structure, 2nd Grade
 |
 |
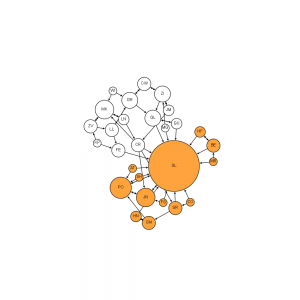 |
| 14 boys and 14 girls. 9 Unchosen; 11 Pairs; 2 Stars; 0 Chains; 1 Triangle; 5 Inter-sexual attractions. Note: the two “CR” nodes have been accidentally merged in the redrawn graphs. |
Class Structure, 3rd Grade
 |
 |
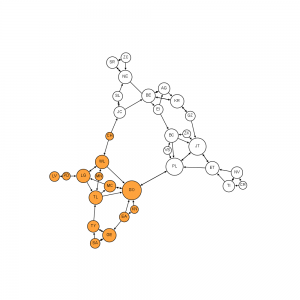 |
| 19 boys and 14 girls. 7 Unchosen; 14 Pairs; 3 Stars; 1 Chains; 0 Triangles; 3 Inter-sexual attractions. |
Class Structure, 4th Grade
 |
 |
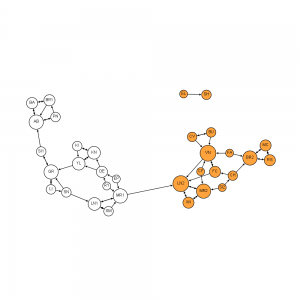 |
| 17 boys and 16 girls. 6 Unchosen; 17 Pairs; 2 Stars; 0 Chains; 2 Triangles; 1 Inter-sexual attractions. |
Class Structure, 5th Grade
 |
 |
 |
| 19(+5) boys and 18(+5) girls. 10 Unchosen; 19 Pairs; 2 Stars; 2 Chains; 2 Triangles; 1 Inter-sexual attractions. |
Class Structure, 6th Grade
 |
 |
 |
| 18(+3) boys and 21(+1) girls. 6 Unchosen; 26 Pairs; 1 Star; 2 Chains; 3 Triangles; 0 Inter-sexual attractions. |
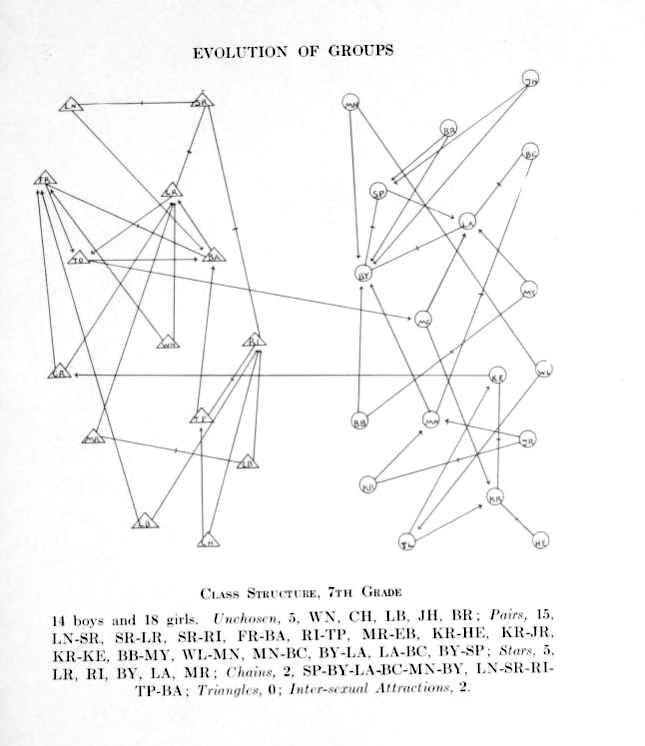
Class Structure, 7th Grade
 |
 |
 |
| 14 boys and 18 girls. 5 Unchosen; 15 Pairs; 5 Stars; 2 Chains; 0 Triangles; 2 Inter-sexual attractions. |
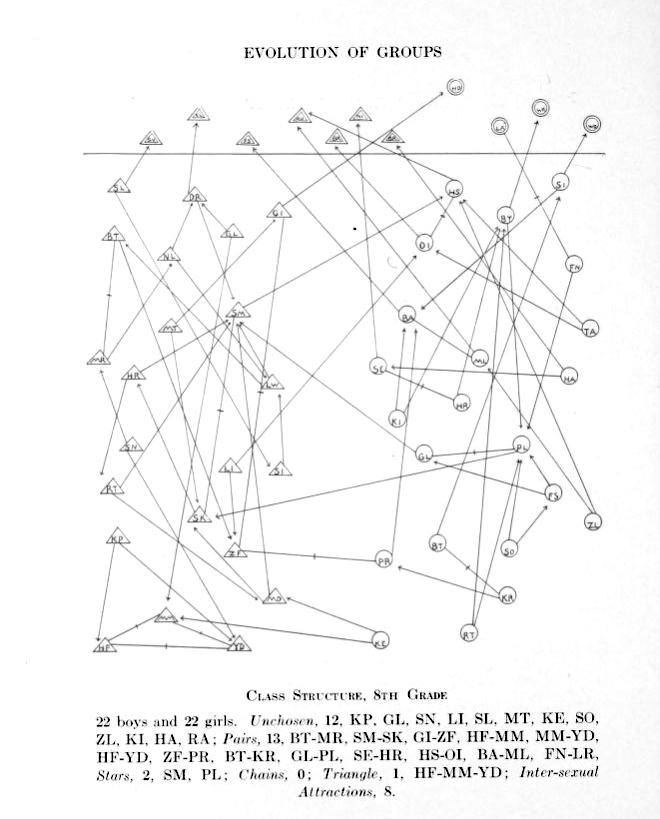
Class Structure, 8th Grade
 |
 |
 |
| 22(+7) boys and 22(+4) girls. 12 Unchosen; 13 Pairs; 2 Stars; 0 Chains; 1 Triangle; 8 Inter-sexual attractions. |
Made with Gephi.
Related


these are great. thanks for the new views of moreno’s sociograms!
In Class Structure, 2nd Grade, why does CR get to pick four people they would want to sit next two?
My mistake, there are 2 CR and I accidentally merged them. I’ll make a note.
What’s up with FE in the second grade? Was FE unable to pick two other students?
Good eyes! I don’t know, it’s the source of only one edge in the original version.